

systems is shown in Fig. 3.39a. The capabilities of HT-2D-LC are convincingly
presented in this application. A complex mixture of PE and PPs with different
tacticities has also been separated as illustrated in Fig. 3.39b.
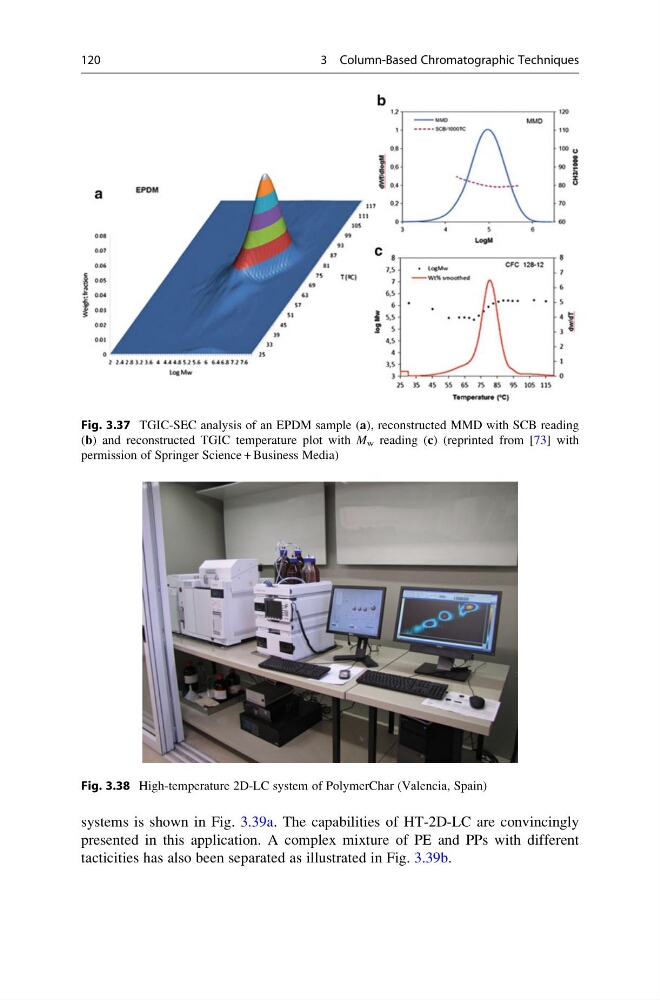
Fig. 3.37 TGIC-SEC analysis of an EPDM sample (a), reconstructed MMD with SCB reading
(b) and reconstructed TGIC temperature plot with M w reading (c) (reprinted from [73] with
permission of Springer Science + Business Media)
Fig. 3.38 High-temperature 2D-LC system of PolymerChar (Valencia, Spain)
120
3 Column-Based Chromatographic Techniques
presented in this application. A complex mixture of PE and PPs with different
tacticities has also been separated as illustrated in Fig. 3.39b.
Fig. 3.37 TGIC-SEC analysis of an EPDM sample (a), reconstructed MMD with SCB reading
(b) and reconstructed TGIC temperature plot with M w reading (c) (reprinted from [73] with
permission of Springer Science + Business Media)
Fig. 3.38 High-temperature 2D-LC system of PolymerChar (Valencia, Spain)
120
3 Column-Based Chromatographic Techniques