

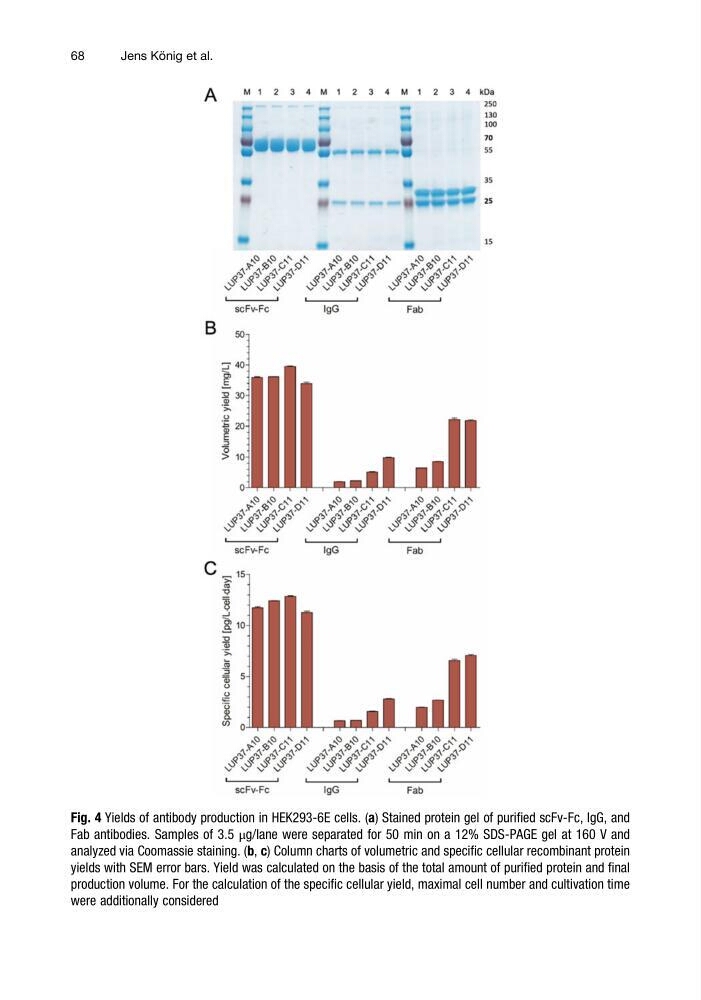
Fig. 4 Yields of antibody production in HEK293-6E cells. (a) Stained protein gel of purified scFv-Fc, IgG, and
Fab antibodies. Samples of 3.5 μg/lane were separated for 50 min on a 12% SDS-PAGE gel at 160 V and
analyzed via Coomassie staining. (b, c) Column charts of volumetric and specific cellular recombinant protein
yields with SEM error bars. Yield was calculated on the basis of the total amount of purified protein and final
production volume. For the calculation of the specific cellular yield, maximal cell number and cultivation time
were additionally considered
68
Jens Ko ¨ nig et al.
Fab antibodies. Samples of 3.5 μg/lane were separated for 50 min on a 12% SDS-PAGE gel at 160 V and
analyzed via Coomassie staining. (b, c) Column charts of volumetric and specific cellular recombinant protein
yields with SEM error bars. Yield was calculated on the basis of the total amount of purified protein and final
production volume. For the calculation of the specific cellular yield, maximal cell number and cultivation time
were additionally considered
68
Jens Ko ¨ nig et al.