

8. Load the samples and run the electrophoresis in TBE buffer at a
constant voltage of 50 V for one gel until the loading dye
reaches half of the gel (see Note 10).
9. Stain the gel with any kind of fluorescent dye for DNA staining,
take a picture, and stain the gel again in protein staining solution to visualize the protein. Only proteins in complex with
DNA will migrate into the gel. Free protein will normally not
separate as TFs are generally positively charged and interact
strongly with negative DNA.
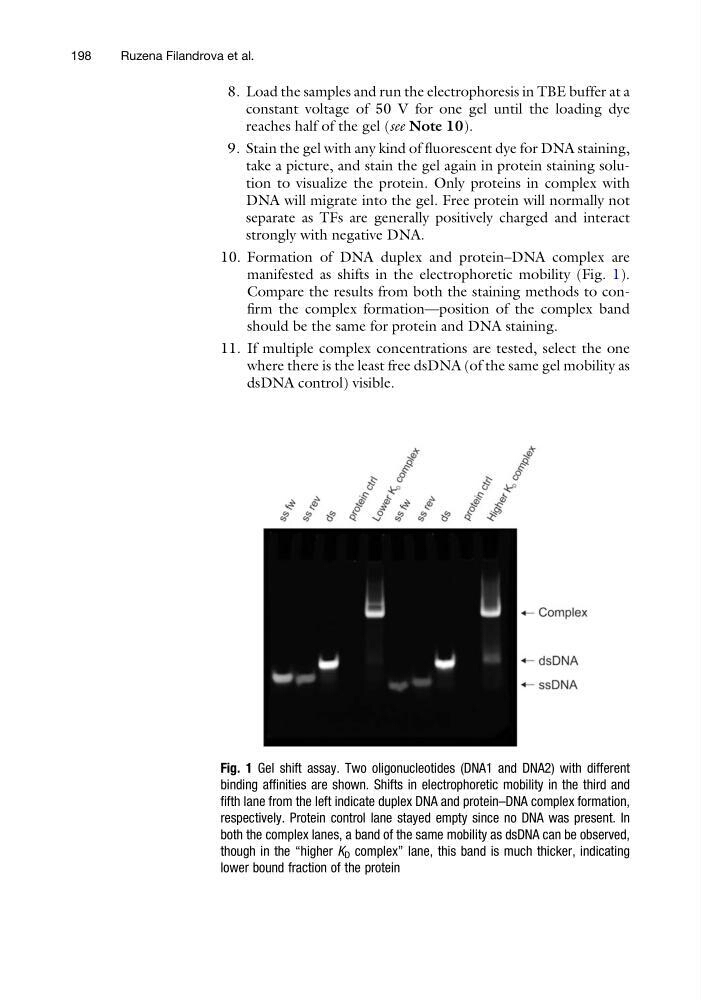
10. Formation of DNA duplex and protein–DNA complex are
manifested as shifts in the electrophoretic mobility (Fig. 1).
Compare the results from both the staining methods to confirm the complex formation—position of the complex band
should be the same for protein and DNA staining.
11. If multiple complex concentrations are tested, select the one
where there is the least free dsDNA (of the same gel mobility as
dsDNA control) visible.
Fig. 1 Gel shift assay. Two oligonucleotides (DNA1 and DNA2) with different
binding affinities are shown. Shifts in electrophoretic mobility in the third and
fifth lane from the left indicate duplex DNA and protein–DNA complex formation,
respectively. Protein control lane stayed empty since no DNA was present. In
both the complex lanes, a band of the same mobility as dsDNA can be observed,
though in the “higher K D complex” lane, this band is much thicker, indicating
lower bound fraction of the protein
198
Ruzena Filandrova et al.
constant voltage of 50 V for one gel until the loading dye
reaches half of the gel (see Note 10).
9. Stain the gel with any kind of fluorescent dye for DNA staining,
take a picture, and stain the gel again in protein staining solution to visualize the protein. Only proteins in complex with
DNA will migrate into the gel. Free protein will normally not
separate as TFs are generally positively charged and interact
strongly with negative DNA.
10. Formation of DNA duplex and protein–DNA complex are
manifested as shifts in the electrophoretic mobility (Fig. 1).
Compare the results from both the staining methods to confirm the complex formation—position of the complex band
should be the same for protein and DNA staining.
11. If multiple complex concentrations are tested, select the one
where there is the least free dsDNA (of the same gel mobility as
dsDNA control) visible.
Fig. 1 Gel shift assay. Two oligonucleotides (DNA1 and DNA2) with different
binding affinities are shown. Shifts in electrophoretic mobility in the third and
fifth lane from the left indicate duplex DNA and protein–DNA complex formation,
respectively. Protein control lane stayed empty since no DNA was present. In
both the complex lanes, a band of the same mobility as dsDNA can be observed,
though in the “higher K D complex” lane, this band is much thicker, indicating
lower bound fraction of the protein
198
Ruzena Filandrova et al.