

4.5
4.0
3.5
3.0
2.5
0.04
0.01
–0.03
residuals
sw (S)
10
-6
10
-5
10
-4
10
-3
concentration (M)
5.8
5.4
5.6
5.2
5.0
4.8
4.6
0.03
–0.01
–0.04
residuals
sw fast (S)
10
-6
10
-5
10
-4
10
-3
concentration (M)
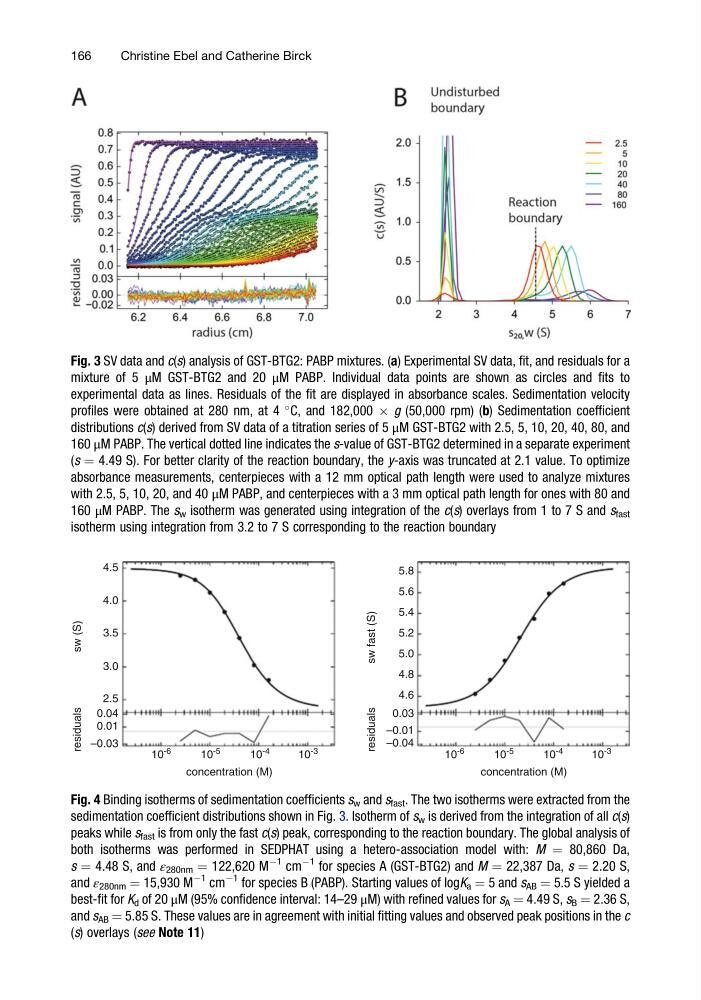
Fig. 4 Binding isotherms of sedimentation coefficients s w and s fast . The two isotherms were extracted from the
sedimentation coefficient distributions shown in Fig. 3. Isotherm of s w is derived from the integration of all c(s)
peaks while s fast is from only the fast c(s) peak, corresponding to the reaction boundary. The global analysis of
both isotherms was performed in SEDPHAT using a hetero-association model with: M ¼ 80,860 Da,
s ¼ 4.48 S, and ε 280nm ¼ 122,620 M
À1
cm
À1
for species A (GST-BTG2) and M ¼ 22,387 Da, s ¼ 2.20 S,
and ε 280nm ¼ 15,930 M
À1
cm
À1
for species B (PABP). Starting values of logK a ¼ 5 and s AB ¼ 5.5 S yielded a
best-fit for K d of 20 μM (95% confidence interval: 14–29 μM) with refined values for s A ¼ 4.49 S, s B ¼ 2.36 S,
and s AB ¼ 5.85 S. These values are in agreement with initial fitting values and observed peak positions in the c
(s) overlays (see Note 11)
Fig. 3 SV data and c(s) analysis of GST-BTG2: PABP mixtures. (a) Experimental SV data, fit, and residuals for a
mixture of 5 μM GST-BTG2 and 20 μM PABP. Individual data points are shown as circles and fits to
experimental data as lines. Residuals of the fit are displayed in absorbance scales. Sedimentation velocity
profiles were obtained at 280 nm, at 4
C, and 182,000 Â g (50,000 rpm) (b) Sedimentation coefficient
distributions c(s) derived from SV data of a titration series of 5 μM GST-BTG2 with 2.5, 5, 10, 20, 40, 80, and
160 μM PABP. The vertical dotted line indicates the s-value of GST-BTG2 determined in a separate experiment
(s ¼ 4.49 S). For better clarity of the reaction boundary, the y-axis was truncated at 2.1 value. To optimize
absorbance measurements, centerpieces with a 12 mm optical path length were used to analyze mixtures
with 2.5, 5, 10, 20, and 40 μM PABP, and centerpieces with a 3 mm optical path length for ones with 80 and
160 μM PABP. The s w isotherm was generated using integration of the c(s) overlays from 1 to 7 S and s fast
isotherm using integration from 3.2 to 7 S corresponding to the reaction boundary
166
Christine Ebel and Catherine Birck
4.0
3.5
3.0
2.5
0.04
0.01
–0.03
residuals
sw (S)
10
-6
10
-5
10
-4
10
-3
concentration (M)
5.8
5.4
5.6
5.2
5.0
4.8
4.6
0.03
–0.01
–0.04
residuals
sw fast (S)
10
-6
10
-5
10
-4
10
-3
concentration (M)
Fig. 4 Binding isotherms of sedimentation coefficients s w and s fast . The two isotherms were extracted from the
sedimentation coefficient distributions shown in Fig. 3. Isotherm of s w is derived from the integration of all c(s)
peaks while s fast is from only the fast c(s) peak, corresponding to the reaction boundary. The global analysis of
both isotherms was performed in SEDPHAT using a hetero-association model with: M ¼ 80,860 Da,
s ¼ 4.48 S, and ε 280nm ¼ 122,620 M
À1
cm
À1
for species A (GST-BTG2) and M ¼ 22,387 Da, s ¼ 2.20 S,
and ε 280nm ¼ 15,930 M
À1
cm
À1
for species B (PABP). Starting values of logK a ¼ 5 and s AB ¼ 5.5 S yielded a
best-fit for K d of 20 μM (95% confidence interval: 14–29 μM) with refined values for s A ¼ 4.49 S, s B ¼ 2.36 S,
and s AB ¼ 5.85 S. These values are in agreement with initial fitting values and observed peak positions in the c
(s) overlays (see Note 11)
Fig. 3 SV data and c(s) analysis of GST-BTG2: PABP mixtures. (a) Experimental SV data, fit, and residuals for a
mixture of 5 μM GST-BTG2 and 20 μM PABP. Individual data points are shown as circles and fits to
experimental data as lines. Residuals of the fit are displayed in absorbance scales. Sedimentation velocity
profiles were obtained at 280 nm, at 4
C, and 182,000 Â g (50,000 rpm) (b) Sedimentation coefficient
distributions c(s) derived from SV data of a titration series of 5 μM GST-BTG2 with 2.5, 5, 10, 20, 40, 80, and
160 μM PABP. The vertical dotted line indicates the s-value of GST-BTG2 determined in a separate experiment
(s ¼ 4.49 S). For better clarity of the reaction boundary, the y-axis was truncated at 2.1 value. To optimize
absorbance measurements, centerpieces with a 12 mm optical path length were used to analyze mixtures
with 2.5, 5, 10, 20, and 40 μM PABP, and centerpieces with a 3 mm optical path length for ones with 80 and
160 μM PABP. The s w isotherm was generated using integration of the c(s) overlays from 1 to 7 S and s fast
isotherm using integration from 3.2 to 7 S corresponding to the reaction boundary
166
Christine Ebel and Catherine Birck