

4 Additional Remarks
1. Before each ITC experiment, make sure that the measurement
cell and the syringe are clean. Clean the sample cell and the
syringe with 14% v/v decon and rinse them with, respectively,
1 l and 250 ml of water. A control ITC measurement is then
performed with 20 injections of 10 μl of water from the syringe
into the cell filled with water. The signal should be small
(DP < 0.01 μcal/s) and regular. The next user can then safely
use the device for his measurements. When needed, stronger
cleaning procedures could be used (see recommendations of the
manufacturer (Malvern)). The Hastelloy alloy that covers the
C
A Ku-NT495 vs DNA 18bp
DNA-FAM5 vs Ku
B
DNA-FAM5 vs Ku
LED power 80%
LED power 100%
DNA-FAM5 vs Ku
MST trace
[Ku] ↗
D
MST power 40% 60%
1.0E-12 1.0E-11 1.0E-10 1.0E-09 1.0E-08 1.0E-07 1.0E-06
Ligand Concentration
-1
0
1
' FNorm [%]
1.0E-11 1.0E-10 1.0E-09 1.0E-08 1.0E-07 1.0E-06 1.0E-05 1.0E-04
Ligand Concentration
1.0E-11 1.0E-10 1.0E-09 1.0E-08 1.0E-07 1.0E-06 1.0E-05 1.0E-04
Ligand Concentration
0
5
10
' FNorm [%]
' FNorm [%]
1.00
0.95
0.90
0.85
Relative Fluorescence [-]
0
5
10
15
20
MST experiment time [s]
8
6
4
2
0
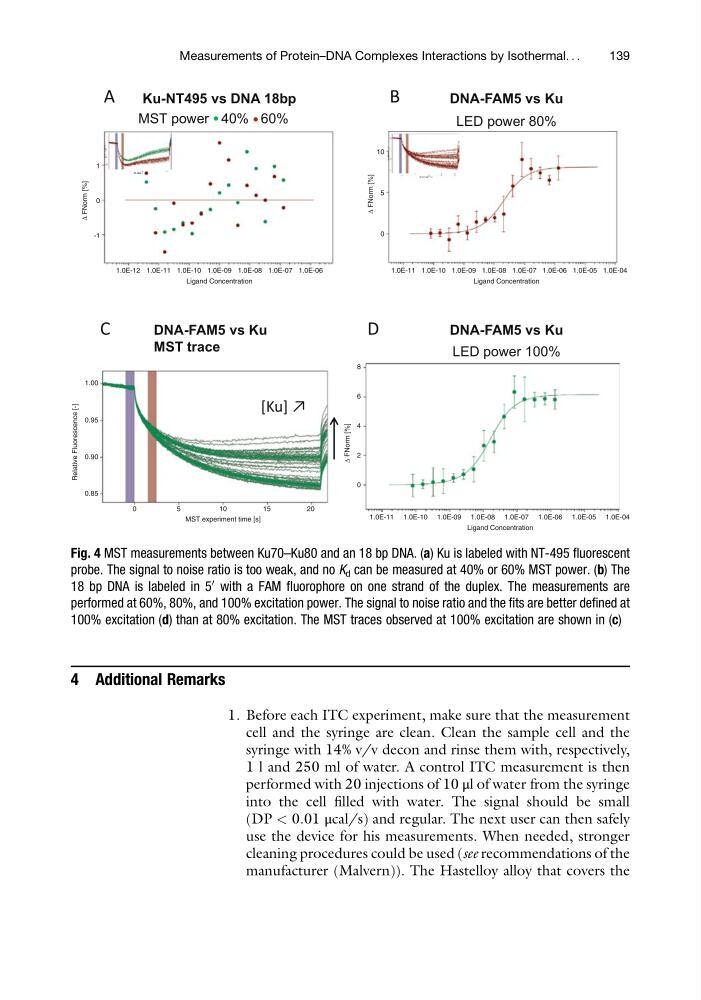
Fig. 4 MST measurements between Ku70–Ku80 and an 18 bp DNA. (a) Ku is labeled with NT-495 fluorescent
probe. The signal to noise ratio is too weak, and no K d can be measured at 40% or 60% MST power. (b) The
18 bp DNA is labeled in 5
0
with a FAM fluorophore on one strand of the duplex. The measurements are
performed at 60%, 80%, and 100% excitation power. The signal to noise ratio and the fits are better defined at
100% excitation (d) than at 80% excitation. The MST traces observed at 100% excitation are shown in (c)
Measurements of Protein–DNA Complexes Interactions by Isothermal. . .
139
1. Before each ITC experiment, make sure that the measurement
cell and the syringe are clean. Clean the sample cell and the
syringe with 14% v/v decon and rinse them with, respectively,
1 l and 250 ml of water. A control ITC measurement is then
performed with 20 injections of 10 μl of water from the syringe
into the cell filled with water. The signal should be small
(DP < 0.01 μcal/s) and regular. The next user can then safely
use the device for his measurements. When needed, stronger
cleaning procedures could be used (see recommendations of the
manufacturer (Malvern)). The Hastelloy alloy that covers the
C
A Ku-NT495 vs DNA 18bp
DNA-FAM5 vs Ku
B
DNA-FAM5 vs Ku
LED power 80%
LED power 100%
DNA-FAM5 vs Ku
MST trace
[Ku] ↗
D
MST power 40% 60%
1.0E-12 1.0E-11 1.0E-10 1.0E-09 1.0E-08 1.0E-07 1.0E-06
Ligand Concentration
-1
0
1
' FNorm [%]
1.0E-11 1.0E-10 1.0E-09 1.0E-08 1.0E-07 1.0E-06 1.0E-05 1.0E-04
Ligand Concentration
1.0E-11 1.0E-10 1.0E-09 1.0E-08 1.0E-07 1.0E-06 1.0E-05 1.0E-04
Ligand Concentration
0
5
10
' FNorm [%]
' FNorm [%]
1.00
0.95
0.90
0.85
Relative Fluorescence [-]
0
5
10
15
20
MST experiment time [s]
8
6
4
2
0
Fig. 4 MST measurements between Ku70–Ku80 and an 18 bp DNA. (a) Ku is labeled with NT-495 fluorescent
probe. The signal to noise ratio is too weak, and no K d can be measured at 40% or 60% MST power. (b) The
18 bp DNA is labeled in 5
0
with a FAM fluorophore on one strand of the duplex. The measurements are
performed at 60%, 80%, and 100% excitation power. The signal to noise ratio and the fits are better defined at
100% excitation (d) than at 80% excitation. The MST traces observed at 100% excitation are shown in (c)
Measurements of Protein–DNA Complexes Interactions by Isothermal. . .
139