

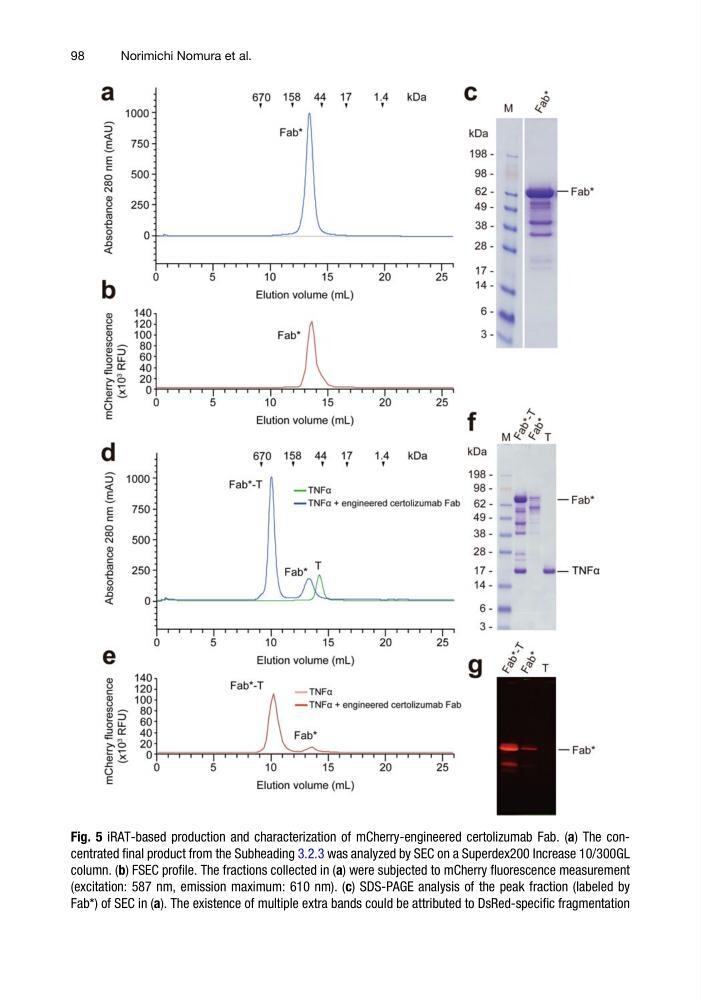
Fig. 5 iRAT-based production and characterization of mCherry-engineered certolizumab Fab. (a) The concentrated final product from the Subheading 3.2.3 was analyzed by SEC on a Superdex200 Increase 10/300GL
column. (b) FSEC profile. The fractions collected in (a) were subjected to mCherry fluorescence measurement
(excitation: 587 nm, emission maximum: 610 nm). (c) SDS-PAGE analysis of the peak fraction (labeled by
Fab*) of SEC in (a). The existence of multiple extra bands could be attributed to DsRed-specific fragmentation
98
Norimichi Nomura et al.
column. (b) FSEC profile. The fractions collected in (a) were subjected to mCherry fluorescence measurement
(excitation: 587 nm, emission maximum: 610 nm). (c) SDS-PAGE analysis of the peak fraction (labeled by
Fab*) of SEC in (a). The existence of multiple extra bands could be attributed to DsRed-specific fragmentation
98
Norimichi Nomura et al.