

212
C. Blazek and V. Blazek
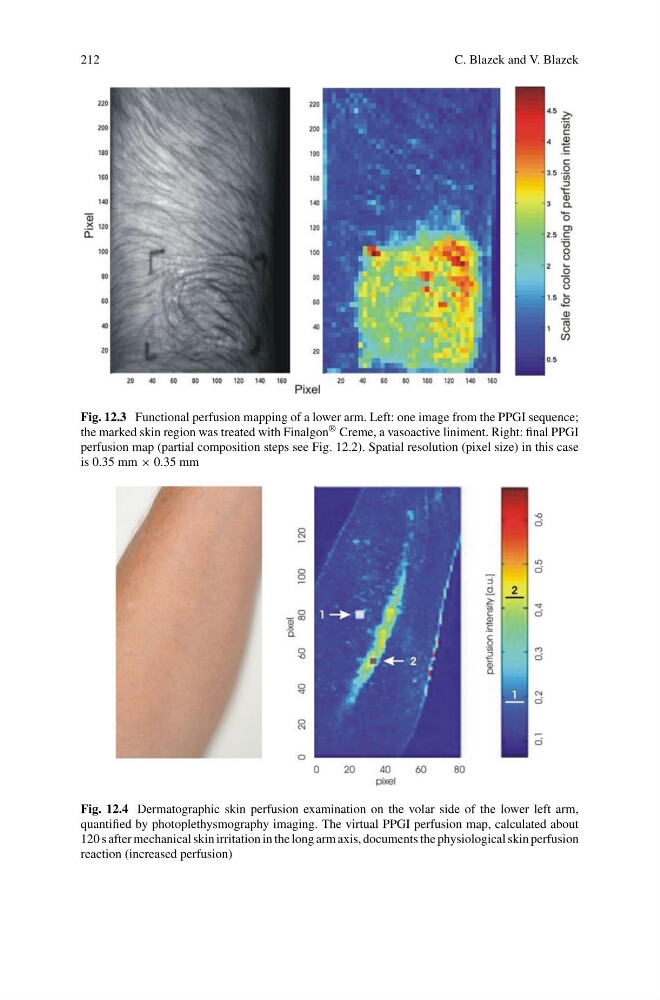
Fig. 12.3 Functional perfusion mapping of a lower arm. Left: one image from the PPGI sequence;
the marked skin region was treated with Finalgon ® Creme, a vasoactive liniment. Right: final PPGI
perfusion map (partial composition steps see Fig. 12.2). Spatial resolution (pixel size) in this case
is 0.35 mm × 0.35 mm
Fig. 12.4 Dermatographic skin perfusion examination on the volar side of the lower left arm,
quantified by photoplethysmography imaging. The virtual PPGI perfusion map, calculated about
120 s after mechanical skin irritation in the long arm axis, documents the physiological skin perfusion
reaction (increased perfusion)
C. Blazek and V. Blazek
Fig. 12.3 Functional perfusion mapping of a lower arm. Left: one image from the PPGI sequence;
the marked skin region was treated with Finalgon ® Creme, a vasoactive liniment. Right: final PPGI
perfusion map (partial composition steps see Fig. 12.2). Spatial resolution (pixel size) in this case
is 0.35 mm × 0.35 mm
Fig. 12.4 Dermatographic skin perfusion examination on the volar side of the lower left arm,
quantified by photoplethysmography imaging. The virtual PPGI perfusion map, calculated about
120 s after mechanical skin irritation in the long arm axis, documents the physiological skin perfusion
reaction (increased perfusion)