

12 Selected Clinical Applications of Functional PPGI Perfusion Mapping …
209
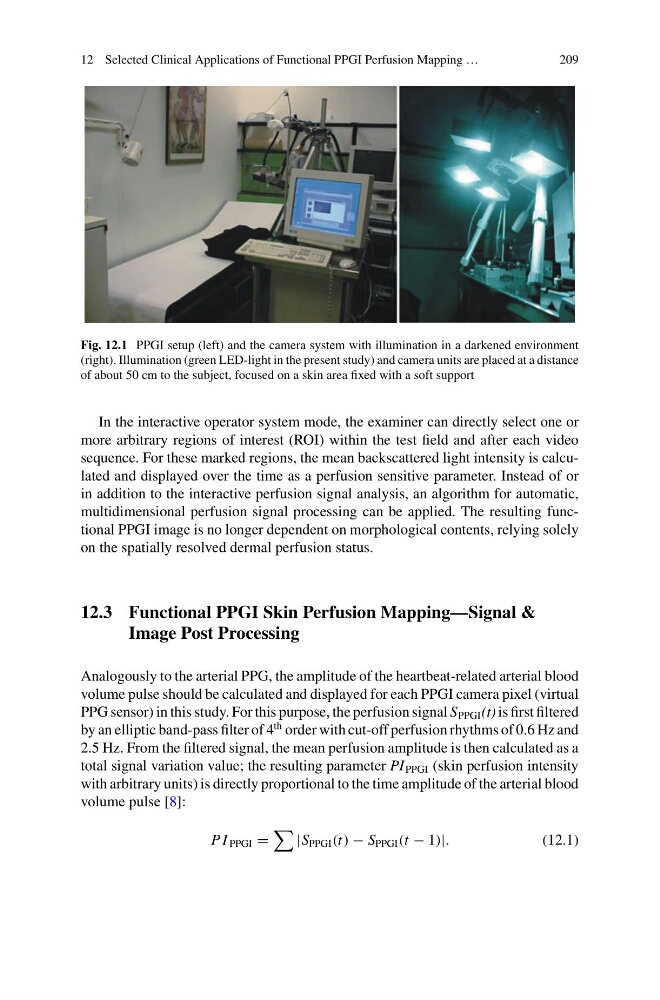
Fig. 12.1 PPGI setup (left) and the camera system with illumination in a darkened environment
(right). Illumination (green LED-light in the present study) and camera units are placed at a distance
of about 50 cm to the subject, focused on a skin area fixed with a soft support
In the interactive operator system mode, the examiner can directly select one or
more arbitrary regions of interest (ROI) within the test field and after each video
sequence. For these marked regions, the mean backscattered light intensity is calculated and displayed over the time as a perfusion sensitive parameter. Instead of or
in addition to the interactive perfusion signal analysis, an algorithm for automatic,
multidimensional perfusion signal processing can be applied. The resulting functional PPGI image is no longer dependent on morphological contents, relying solely
on the spatially resolved dermal perfusion status.
12.3 Functional PPGI Skin Perfusion Mapping—Signal &
Image Post Processing
Analogously to the arterial PPG, the amplitude of the heartbeat-related arterial blood
volume pulse should be calculated and displayed for each PPGI camera pixel (virtual
PPG sensor) in this study. For this purpose, the perfusion signal S PPGI (t) is first filtered
by an elliptic band-pass filter of 4
th order with cut-off perfusion rhythms of 0.6 Hz and
2.5 Hz. From the filtered signal, the mean perfusion amplitude is then calculated as a
total signal variation value; the resulting parameter PI PPGI (skin perfusion intensity
with arbitrary units) is directly proportional to the time amplitude of the arterial blood
volume pulse [8]:
P I PPGI =
|S PPGI (t) − S PPGI (t − 1)|.
(12.1)
209
Fig. 12.1 PPGI setup (left) and the camera system with illumination in a darkened environment
(right). Illumination (green LED-light in the present study) and camera units are placed at a distance
of about 50 cm to the subject, focused on a skin area fixed with a soft support
In the interactive operator system mode, the examiner can directly select one or
more arbitrary regions of interest (ROI) within the test field and after each video
sequence. For these marked regions, the mean backscattered light intensity is calculated and displayed over the time as a perfusion sensitive parameter. Instead of or
in addition to the interactive perfusion signal analysis, an algorithm for automatic,
multidimensional perfusion signal processing can be applied. The resulting functional PPGI image is no longer dependent on morphological contents, relying solely
on the spatially resolved dermal perfusion status.
12.3 Functional PPGI Skin Perfusion Mapping—Signal &
Image Post Processing
Analogously to the arterial PPG, the amplitude of the heartbeat-related arterial blood
volume pulse should be calculated and displayed for each PPGI camera pixel (virtual
PPG sensor) in this study. For this purpose, the perfusion signal S PPGI (t) is first filtered
by an elliptic band-pass filter of 4
th order with cut-off perfusion rhythms of 0.6 Hz and
2.5 Hz. From the filtered signal, the mean perfusion amplitude is then calculated as a
total signal variation value; the resulting parameter PI PPGI (skin perfusion intensity
with arbitrary units) is directly proportional to the time amplitude of the arterial blood
volume pulse [8]:
P I PPGI =
|S PPGI (t) − S PPGI (t − 1)|.
(12.1)