

156
M. Koeny
the ANI from ECG and from PPG signal. Then, the computation of HRV from PPG
was validated, and the ANI-PPG was evaluated using recorded patient data.
To validate HRV computation from PPG, many studies have been performed
previously [9, 10]. Unfortunately, most of these studies were set up in a controlled
environment where patients underwent no or only less hemodynamic changes. In
such studies, the correlation between ECG-HRV and PPG-HRV can differ due to
physiological reasons. One of the most important aspects is the different location of
measurement (central vs. peripheral) and thus the influence of local phenomena, like
vasomotion, to the PPG signal.
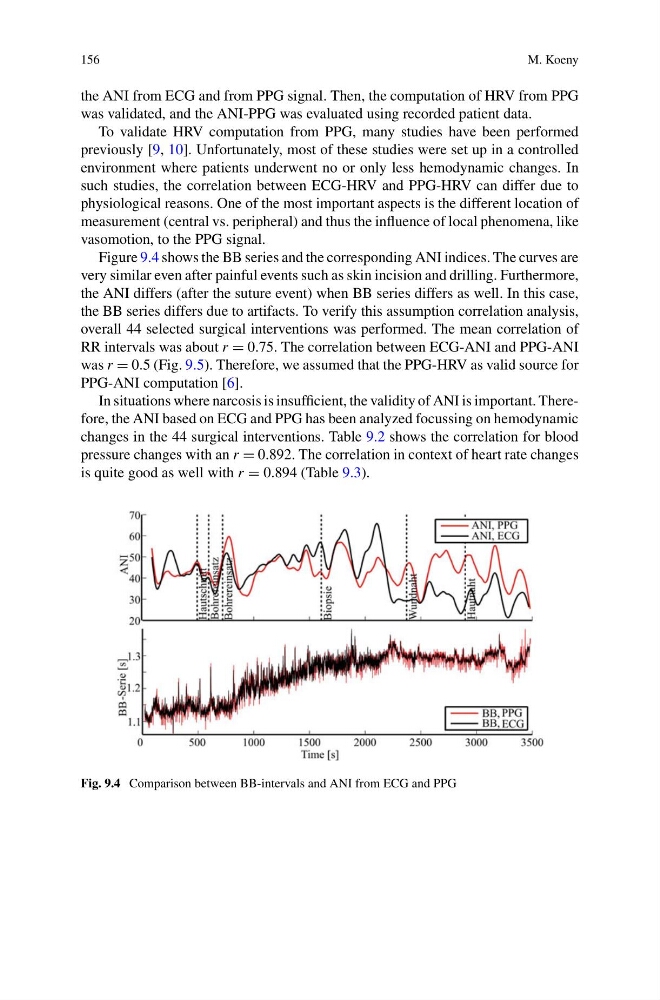
Figure 9.4 shows the BB series and the corresponding ANI indices. The curves are
very similar even after painful events such as skin incision and drilling. Furthermore,
the ANI differs (after the suture event) when BB series differs as well. In this case,
the BB series differs due to artifacts. To verify this assumption correlation analysis,
overall 44 selected surgical interventions was performed. The mean correlation of
RR intervals was about r = 0.75. The correlation between ECG-ANI and PPG-ANI
was r = 0.5 (Fig. 9.5). Therefore, we assumed that the PPG-HRV as valid source for
PPG-ANI computation [6].
In situations where narcosis is insufficient, the validity of ANI is important. Therefore, the ANI based on ECG and PPG has been analyzed focussing on hemodynamic
changes in the 44 surgical interventions. Table 9.2 shows the correlation for blood
pressure changes with an r = 0.892. The correlation in context of heart rate changes
is quite good as well with r = 0.894 (Table 9.3).
Fig. 9.4 Comparison between BB-intervals and ANI from ECG and PPG
M. Koeny
the ANI from ECG and from PPG signal. Then, the computation of HRV from PPG
was validated, and the ANI-PPG was evaluated using recorded patient data.
To validate HRV computation from PPG, many studies have been performed
previously [9, 10]. Unfortunately, most of these studies were set up in a controlled
environment where patients underwent no or only less hemodynamic changes. In
such studies, the correlation between ECG-HRV and PPG-HRV can differ due to
physiological reasons. One of the most important aspects is the different location of
measurement (central vs. peripheral) and thus the influence of local phenomena, like
vasomotion, to the PPG signal.
Figure 9.4 shows the BB series and the corresponding ANI indices. The curves are
very similar even after painful events such as skin incision and drilling. Furthermore,
the ANI differs (after the suture event) when BB series differs as well. In this case,
the BB series differs due to artifacts. To verify this assumption correlation analysis,
overall 44 selected surgical interventions was performed. The mean correlation of
RR intervals was about r = 0.75. The correlation between ECG-ANI and PPG-ANI
was r = 0.5 (Fig. 9.5). Therefore, we assumed that the PPG-HRV as valid source for
PPG-ANI computation [6].
In situations where narcosis is insufficient, the validity of ANI is important. Therefore, the ANI based on ECG and PPG has been analyzed focussing on hemodynamic
changes in the 44 surgical interventions. Table 9.2 shows the correlation for blood
pressure changes with an r = 0.892. The correlation in context of heart rate changes
is quite good as well with r = 0.894 (Table 9.3).
Fig. 9.4 Comparison between BB-intervals and ANI from ECG and PPG