

9 Analyzing Pain and Stress from PPG Perfusion Signal Patterns
153
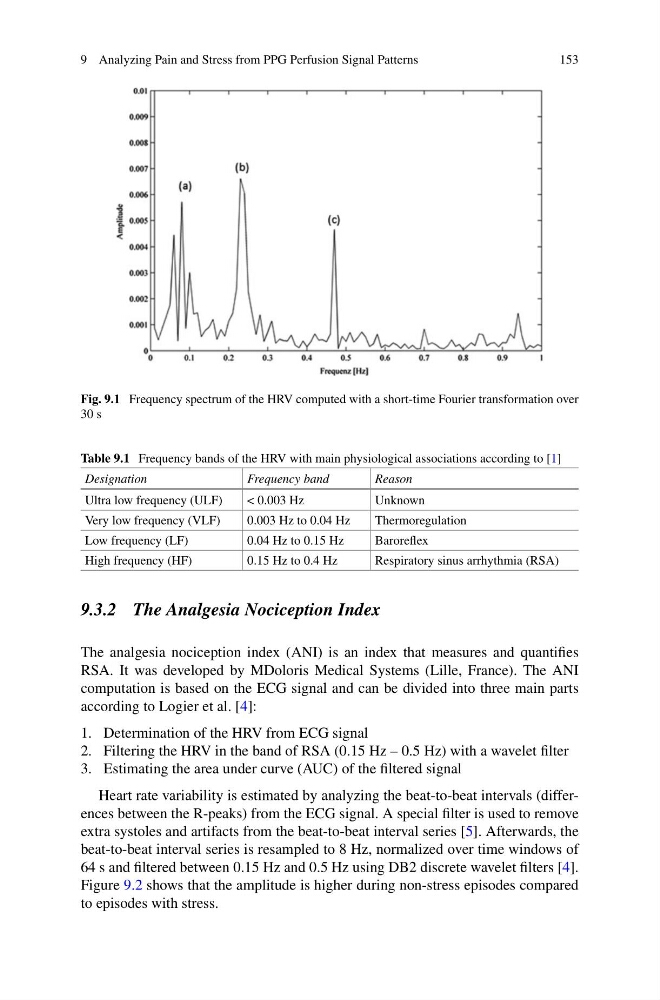
Fig. 9.1 Frequency spectrum of the HRV computed with a short-time Fourier transformation over
30 s
Table 9.1 Frequency bands of the HRV with main physiological associations according to [1]
Designation
Frequency band
Reason
Ultra low frequency (ULF)
< 0.003 Hz
Unknown
Very low frequency (VLF)
0.003 Hz to 0.04 Hz
Thermoregulation
Low frequency (LF)
0.04 Hz to 0.15 Hz
Baroreflex
High frequency (HF)
0.15 Hz to 0.4 Hz
Respiratory sinus arrhythmia (RSA)
9.3.2 The Analgesia Nociception Index
The analgesia nociception index (ANI) is an index that measures and quantifies
RSA. It was developed by MDoloris Medical Systems (Lille, France). The ANI
computation is based on the ECG signal and can be divided into three main parts
according to Logier et al. [4]:
1. Determination of the HRV from ECG signal
2. Filtering the HRV in the band of RSA (0.15 Hz – 0.5 Hz) with a wavelet filter
3. Estimating the area under curve (AUC) of the filtered signal
Heart rate variability is estimated by analyzing the beat-to-beat intervals (differences between the R-peaks) from the ECG signal. A special filter is used to remove
extra systoles and artifacts from the beat-to-beat interval series [5]. Afterwards, the
beat-to-beat interval series is resampled to 8 Hz, normalized over time windows of
64 s and filtered between 0.15 Hz and 0.5 Hz using DB2 discrete wavelet filters [4].
Figure 9.2 shows that the amplitude is higher during non-stress episodes compared
to episodes with stress.
153
Fig. 9.1 Frequency spectrum of the HRV computed with a short-time Fourier transformation over
30 s
Table 9.1 Frequency bands of the HRV with main physiological associations according to [1]
Designation
Frequency band
Reason
Ultra low frequency (ULF)
< 0.003 Hz
Unknown
Very low frequency (VLF)
0.003 Hz to 0.04 Hz
Thermoregulation
Low frequency (LF)
0.04 Hz to 0.15 Hz
Baroreflex
High frequency (HF)
0.15 Hz to 0.4 Hz
Respiratory sinus arrhythmia (RSA)
9.3.2 The Analgesia Nociception Index
The analgesia nociception index (ANI) is an index that measures and quantifies
RSA. It was developed by MDoloris Medical Systems (Lille, France). The ANI
computation is based on the ECG signal and can be divided into three main parts
according to Logier et al. [4]:
1. Determination of the HRV from ECG signal
2. Filtering the HRV in the band of RSA (0.15 Hz – 0.5 Hz) with a wavelet filter
3. Estimating the area under curve (AUC) of the filtered signal
Heart rate variability is estimated by analyzing the beat-to-beat intervals (differences between the R-peaks) from the ECG signal. A special filter is used to remove
extra systoles and artifacts from the beat-to-beat interval series [5]. Afterwards, the
beat-to-beat interval series is resampled to 8 Hz, normalized over time windows of
64 s and filtered between 0.15 Hz and 0.5 Hz using DB2 discrete wavelet filters [4].
Figure 9.2 shows that the amplitude is higher during non-stress episodes compared
to episodes with stress.