

resolution and sensitivity are lost. However, energy loss and plural scattering in the
specimen affects the image quality differently in STEM and TEM. A STEM
detector records angular variations in the scattering of electrons rather than changes
in their energy. Hence chromatic effects do not severely affect the image quality. In
the case of TEM, phase coherence is strongly affected by chromatic effects, because
electrons have to pass through the objective lens and its chromatic aberration causes
energy-loss electrons to be imaged imperfectly onto the camera, causing blurring of
the image.
The resolution of a STEM image is related to the angular broadening of the beam
upon propagation through the sample. The spreading of a STEM probe in thick
biological samples is, to first approximation, governed by two effects: the geometrical beam divergence and the broadening due to plural elastic scattering in the
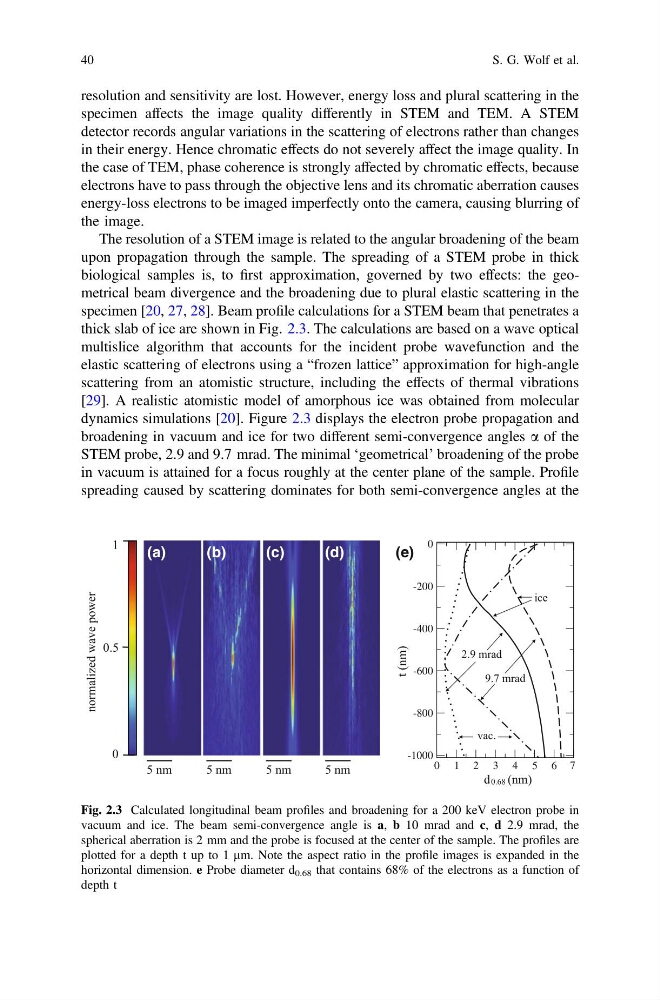
specimen [20, 27, 28]. Beam profile calculations for a STEM beam that penetrates a
thick slab of ice are shown in Fig. 2.3. The calculations are based on a wave optical
multislice algorithm that accounts for the incident probe wavefunction and the
elastic scattering of electrons using a “frozen lattice” approximation for high-angle
scattering from an atomistic structure, including the effects of thermal vibrations
[29]. A realistic atomistic model of amorphous ice was obtained from molecular
dynamics simulations [20]. Figure 2.3 displays the electron probe propagation and
broadening in vacuum and ice for two different semi-convergence angles a of the
STEM probe, 2.9 and 9.7 mrad. The minimal ‘geometrical’ broadening of the probe
in vacuum is attained for a focus roughly at the center plane of the sample. Profile
spreading caused by scattering dominates for both semi-convergence angles at the
d0.68 (nm)
0 1 2 3 4 5 6 7
-1000
-800
-600
-400
-200
0
t (nm)
9.7 mrad
2.9 mrad
vac.
ice
normalized wave power
0
1
0.5
5 nm
5 nm
5 nm
5 nm
(a)
(b)
(c)
(d)
(e)
Fig. 2.3 Calculated longitudinal beam profiles and broadening for a 200 keV electron probe in
vacuum and ice. The beam semi-convergence angle is a, b 10 mrad and c, d 2.9 mrad, the
spherical aberration is 2 mm and the probe is focused at the center of the sample. The profiles are
plotted for a depth t up to 1 lm. Note the aspect ratio in the profile images is expanded in the
horizontal dimension. e Probe diameter d 0.68 that contains 68% of the electrons as a function of
depth t
40
S. G. Wolf et al.
specimen affects the image quality differently in STEM and TEM. A STEM
detector records angular variations in the scattering of electrons rather than changes
in their energy. Hence chromatic effects do not severely affect the image quality. In
the case of TEM, phase coherence is strongly affected by chromatic effects, because
electrons have to pass through the objective lens and its chromatic aberration causes
energy-loss electrons to be imaged imperfectly onto the camera, causing blurring of
the image.
The resolution of a STEM image is related to the angular broadening of the beam
upon propagation through the sample. The spreading of a STEM probe in thick
biological samples is, to first approximation, governed by two effects: the geometrical beam divergence and the broadening due to plural elastic scattering in the
specimen [20, 27, 28]. Beam profile calculations for a STEM beam that penetrates a
thick slab of ice are shown in Fig. 2.3. The calculations are based on a wave optical
multislice algorithm that accounts for the incident probe wavefunction and the
elastic scattering of electrons using a “frozen lattice” approximation for high-angle
scattering from an atomistic structure, including the effects of thermal vibrations
[29]. A realistic atomistic model of amorphous ice was obtained from molecular
dynamics simulations [20]. Figure 2.3 displays the electron probe propagation and
broadening in vacuum and ice for two different semi-convergence angles a of the
STEM probe, 2.9 and 9.7 mrad. The minimal ‘geometrical’ broadening of the probe
in vacuum is attained for a focus roughly at the center plane of the sample. Profile
spreading caused by scattering dominates for both semi-convergence angles at the
d0.68 (nm)
0 1 2 3 4 5 6 7
-1000
-800
-600
-400
-200
0
t (nm)
9.7 mrad
2.9 mrad
vac.
ice
normalized wave power
0
1
0.5
5 nm
5 nm
5 nm
5 nm
(a)
(b)
(c)
(d)
(e)
Fig. 2.3 Calculated longitudinal beam profiles and broadening for a 200 keV electron probe in
vacuum and ice. The beam semi-convergence angle is a, b 10 mrad and c, d 2.9 mrad, the
spherical aberration is 2 mm and the probe is focused at the center of the sample. The profiles are
plotted for a depth t up to 1 lm. Note the aspect ratio in the profile images is expanded in the
horizontal dimension. e Probe diameter d 0.68 that contains 68% of the electrons as a function of
depth t
40
S. G. Wolf et al.