

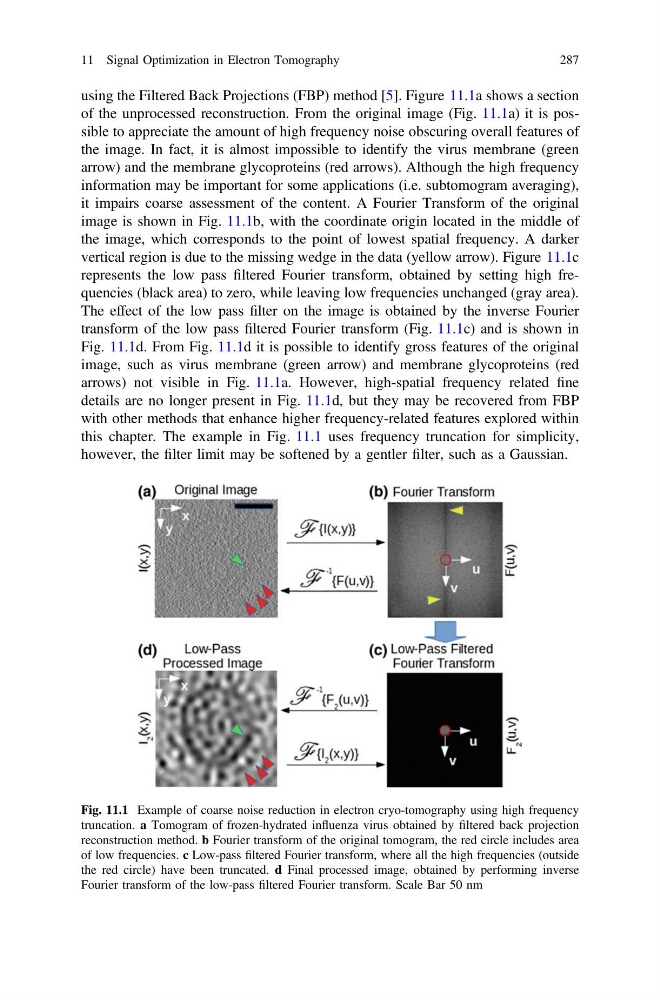
using the Filtered Back Projections (FBP) method [5]. Figure 11.1a shows a section
of the unprocessed reconstruction. From the original image (Fig. 11.1a) it is possible to appreciate the amount of high frequency noise obscuring overall features of
the image. In fact, it is almost impossible to identify the virus membrane (green
arrow) and the membrane glycoproteins (red arrows). Although the high frequency
information may be important for some applications (i.e. subtomogram averaging),
it impairs coarse assessment of the content. A Fourier Transform of the original
image is shown in Fig. 11.1b, with the coordinate origin located in the middle of
the image, which corresponds to the point of lowest spatial frequency. A darker
vertical region is due to the missing wedge in the data (yellow arrow). Figure 11.1c
represents the low pass filtered Fourier transform, obtained by setting high frequencies (black area) to zero, while leaving low frequencies unchanged (gray area).
The effect of the low pass filter on the image is obtained by the inverse Fourier
transform of the low pass filtered Fourier transform (Fig. 11.1c) and is shown in
Fig. 11.1d. From Fig. 11.1d it is possible to identify gross features of the original
image, such as virus membrane (green arrow) and membrane glycoproteins (red
arrows) not visible in Fig. 11.1a. However, high-spatial frequency related fine
details are no longer present in Fig. 11.1d, but they may be recovered from FBP
with other methods that enhance higher frequency-related features explored within
this chapter. The example in Fig. 11.1 uses frequency truncation for simplicity,
however, the filter limit may be softened by a gentler filter, such as a Gaussian.
Fig. 11.1 Example of coarse noise reduction in electron cryo-tomography using high frequency
truncation. a Tomogram of frozen-hydrated influenza virus obtained by filtered back projection
reconstruction method. b Fourier transform of the original tomogram, the red circle includes area
of low frequencies. c Low-pass filtered Fourier transform, where all the high frequencies (outside
the red circle) have been truncated. d Final processed image, obtained by performing inverse
Fourier transform of the low-pass filtered Fourier transform. Scale Bar 50 nm
11 Signal Optimization in Electron Tomography
287
of the unprocessed reconstruction. From the original image (Fig. 11.1a) it is possible to appreciate the amount of high frequency noise obscuring overall features of
the image. In fact, it is almost impossible to identify the virus membrane (green
arrow) and the membrane glycoproteins (red arrows). Although the high frequency
information may be important for some applications (i.e. subtomogram averaging),
it impairs coarse assessment of the content. A Fourier Transform of the original
image is shown in Fig. 11.1b, with the coordinate origin located in the middle of
the image, which corresponds to the point of lowest spatial frequency. A darker
vertical region is due to the missing wedge in the data (yellow arrow). Figure 11.1c
represents the low pass filtered Fourier transform, obtained by setting high frequencies (black area) to zero, while leaving low frequencies unchanged (gray area).
The effect of the low pass filter on the image is obtained by the inverse Fourier
transform of the low pass filtered Fourier transform (Fig. 11.1c) and is shown in
Fig. 11.1d. From Fig. 11.1d it is possible to identify gross features of the original
image, such as virus membrane (green arrow) and membrane glycoproteins (red
arrows) not visible in Fig. 11.1a. However, high-spatial frequency related fine
details are no longer present in Fig. 11.1d, but they may be recovered from FBP
with other methods that enhance higher frequency-related features explored within
this chapter. The example in Fig. 11.1 uses frequency truncation for simplicity,
however, the filter limit may be softened by a gentler filter, such as a Gaussian.
Fig. 11.1 Example of coarse noise reduction in electron cryo-tomography using high frequency
truncation. a Tomogram of frozen-hydrated influenza virus obtained by filtered back projection
reconstruction method. b Fourier transform of the original tomogram, the red circle includes area
of low frequencies. c Low-pass filtered Fourier transform, where all the high frequencies (outside
the red circle) have been truncated. d Final processed image, obtained by performing inverse
Fourier transform of the low-pass filtered Fourier transform. Scale Bar 50 nm
11 Signal Optimization in Electron Tomography
287