

Dm ¼
ffiffiffiffiffiffiffiffiffiffiffiffiffiffiffiffiffiffiffiffiffiffiffi ffi
2 Ã dFE Ã L
p
ð10:9Þ
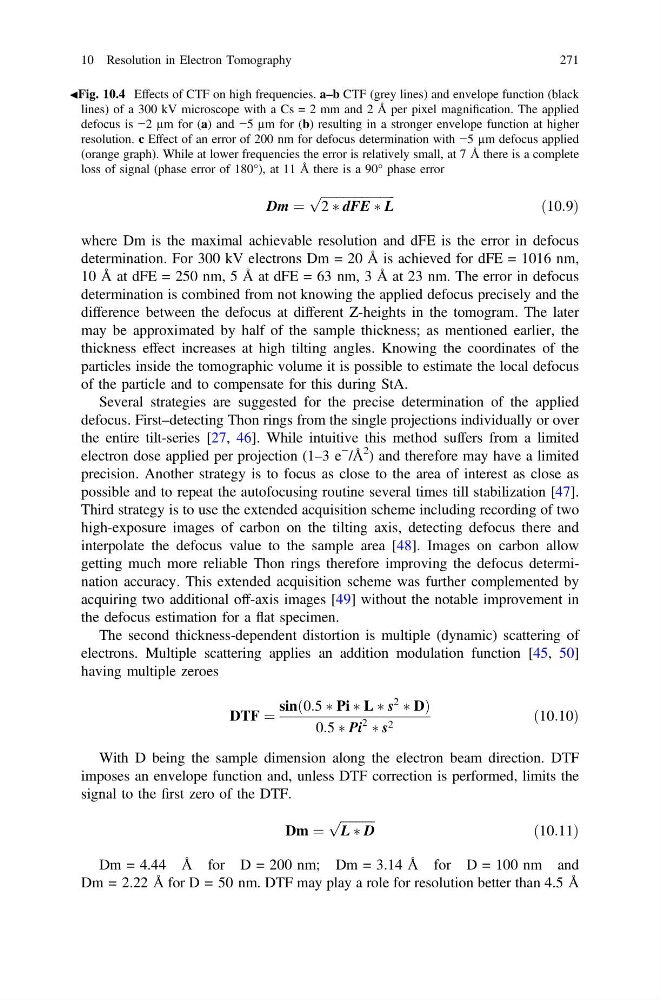
where Dm is the maximal achievable resolution and dFE is the error in defocus
determination. For 300 kV electrons Dm = 20 Å is achieved for dFE = 1016 nm,
10 Å at dFE = 250 nm, 5 Å at dFE = 63 nm, 3 Å at 23 nm. The error in defocus
determination is combined from not knowing the applied defocus precisely and the
difference between the defocus at different Z-heights in the tomogram. The later
may be approximated by half of the sample thickness; as mentioned earlier, the
thickness effect increases at high tilting angles. Knowing the coordinates of the
particles inside the tomographic volume it is possible to estimate the local defocus
of the particle and to compensate for this during StA.
Several strategies are suggested for the precise determination of the applied
defocus. First–detecting Thon rings from the single projections individually or over
the entire tilt-series [27, 46]. While intuitive this method suffers from a limited
electron dose applied per projection (1–3 e
− /Å
2 ) and therefore may have a limited
precision. Another strategy is to focus as close to the area of interest as close as
possible and to repeat the autofocusing routine several times till stabilization [47].
Third strategy is to use the extended acquisition scheme including recording of two
high-exposure images of carbon on the tilting axis, detecting defocus there and
interpolate the defocus value to the sample area [48]. Images on carbon allow
getting much more reliable Thon rings therefore improving the defocus determination accuracy. This extended acquisition scheme was further complemented by
acquiring two additional off-axis images [49] without the notable improvement in
the defocus estimation for a flat specimen.
The second thickness-dependent distortion is multiple (dynamic) scattering of
electrons. Multiple scattering applies an addition modulation function [45, 50]
having multiple zeroes
DTF ¼
sin 0:5 à Pi à L à s
2
à D
ð
Þ
0:5 Ã Pi
2
às 2
ð10:10Þ
With D being the sample dimension along the electron beam direction. DTF
imposes an envelope function and, unless DTF correction is performed, limits the
signal to the first zero of the DTF.
Dm ¼
ffiffiffiffiffiffiffiffiffiffiffi
L Ã D
p
ð10:11Þ
Dm = 4.44 Å for D = 200 nm; Dm = 3.14 Å for D = 100 nm and
Dm = 2.22 Å for D = 50 nm. DTF may play a role for resolution better than 4.5 Å
JFig. 10.4 Effects of CTF on high frequencies. a–b CTF (grey lines) and envelope function (black
lines) of a 300 kV microscope with a Cs = 2 mm and 2 Å per pixel magnification. The applied
defocus is −2 µm for (a) and −5 µm for (b) resulting in a stronger envelope function at higher
resolution. c Effect of an error of 200 nm for defocus determination with −5 µm defocus applied
(orange graph). While at lower frequencies the error is relatively small, at 7 Å there is a complete
loss of signal (phase error of 180°), at 11 Å there is a 90° phase error
10 Resolution in Electron Tomography
271
ffiffiffiffiffiffiffiffiffiffiffiffiffiffiffiffiffiffiffiffiffiffiffi ffi
2 Ã dFE Ã L
p
ð10:9Þ
where Dm is the maximal achievable resolution and dFE is the error in defocus
determination. For 300 kV electrons Dm = 20 Å is achieved for dFE = 1016 nm,
10 Å at dFE = 250 nm, 5 Å at dFE = 63 nm, 3 Å at 23 nm. The error in defocus
determination is combined from not knowing the applied defocus precisely and the
difference between the defocus at different Z-heights in the tomogram. The later
may be approximated by half of the sample thickness; as mentioned earlier, the
thickness effect increases at high tilting angles. Knowing the coordinates of the
particles inside the tomographic volume it is possible to estimate the local defocus
of the particle and to compensate for this during StA.
Several strategies are suggested for the precise determination of the applied
defocus. First–detecting Thon rings from the single projections individually or over
the entire tilt-series [27, 46]. While intuitive this method suffers from a limited
electron dose applied per projection (1–3 e
− /Å
2 ) and therefore may have a limited
precision. Another strategy is to focus as close to the area of interest as close as
possible and to repeat the autofocusing routine several times till stabilization [47].
Third strategy is to use the extended acquisition scheme including recording of two
high-exposure images of carbon on the tilting axis, detecting defocus there and
interpolate the defocus value to the sample area [48]. Images on carbon allow
getting much more reliable Thon rings therefore improving the defocus determination accuracy. This extended acquisition scheme was further complemented by
acquiring two additional off-axis images [49] without the notable improvement in
the defocus estimation for a flat specimen.
The second thickness-dependent distortion is multiple (dynamic) scattering of
electrons. Multiple scattering applies an addition modulation function [45, 50]
having multiple zeroes
DTF ¼
sin 0:5 à Pi à L à s
2
à D
ð
Þ
0:5 Ã Pi
2
às 2
ð10:10Þ
With D being the sample dimension along the electron beam direction. DTF
imposes an envelope function and, unless DTF correction is performed, limits the
signal to the first zero of the DTF.
Dm ¼
ffiffiffiffiffiffiffiffiffiffiffi
L Ã D
p
ð10:11Þ
Dm = 4.44 Å for D = 200 nm; Dm = 3.14 Å for D = 100 nm and
Dm = 2.22 Å for D = 50 nm. DTF may play a role for resolution better than 4.5 Å
JFig. 10.4 Effects of CTF on high frequencies. a–b CTF (grey lines) and envelope function (black
lines) of a 300 kV microscope with a Cs = 2 mm and 2 Å per pixel magnification. The applied
defocus is −2 µm for (a) and −5 µm for (b) resulting in a stronger envelope function at higher
resolution. c Effect of an error of 200 nm for defocus determination with −5 µm defocus applied
(orange graph). While at lower frequencies the error is relatively small, at 7 Å there is a complete
loss of signal (phase error of 180°), at 11 Å there is a 90° phase error
10 Resolution in Electron Tomography
271