

tissues [19] or cultured cells [20]. Imaging the surface of a resin-embedded and
typically osmium-stained block is imaged by a scanning electron microscope. Each
successive surface is removed by a diamond knife (“serial block face”, [15]) or a
focused ion beam (“FIB-SEM”, [16, 17]). The newly exposed surface is imaged and
the recorded images are aligned in a 3D stack. Serial thin sections and array
tomography is performed by TEM with the consecutive alignment of slices into the
3D-volumes.
The above mentioned methods, sometimes called tomography, allow for the
creation of 3D volumes with anisotropic resolution, however the section-based
methods are not generated by tomographic reconstruction [21] but by assembling
the 3D volumes layer-by-layer. Array tomography, serial block face and FIB-SEM
have a Z-resolution that is determined by the thickness of the section or by the
thickness of the layer erased between the consecutive images. The X-Y resolution is
typically limited by sampling (twice the pixel size) and sample preparation, which
is also dependent on the electron dose per exposure and energy of the applied
electrons.
10.2.2 Imaging Cryo Preserved Samples
Cryo-fixation preserves biological features to atomic details [22] however the
sample becomes radiation sensitive and degrades upon exposure in a
dose-dependent manner [23, 24]. However, additionally to degradation the vitreous
ice moves in a non-isotropic way and may diverge by as much as 6 Å over a
distance of 300 nm and an exposure 35 e
− /Å
2 [25]. This dose is 2–5 times smaller
than is typically used for tomograms used for subtomogram averaging [26],
application of higher dose further increases the anisotropic movement of density.
The resulting tomograms are therefore not generated by imaging “rigid bodies” and
may result in incoherent reconstructions.
The observed contrast between the electron scattering of buffer (mostly H and O
atoms) and of proteins and lipids (mostly O, H, C, N, P) is weak, therefore the
biological samples are called weak phase objects. Limited contrast is enhanced by
defocusing the microscope’s objective lens introducing a non-linear oscillating
contrast transfer function (CTF, Fig. 3.3, Chap. 3).
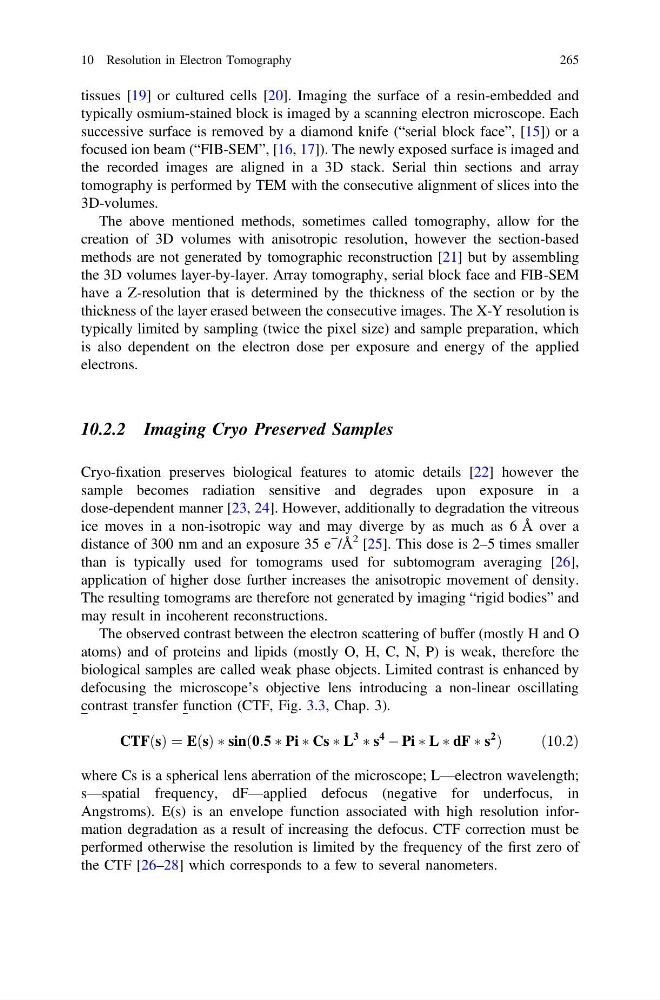
CTFðsÞ ¼ EðsÞ Ã sinð0:5 à Pi à Cs à L
3
à s
4
À Pi à L à dF à s
2
Þ
ð10:2Þ
where Cs is a spherical lens aberration of the microscope; L—electron wavelength;
s—spatial frequency, dF—applied defocus (negative for underfocus, in
Angstroms). E(s) is an envelope function associated with high resolution information degradation as a result of increasing the defocus. CTF correction must be
performed otherwise the resolution is limited by the frequency of the first zero of
the CTF [26–28] which corresponds to a few to several nanometers.
10 Resolution in Electron Tomography
265
typically osmium-stained block is imaged by a scanning electron microscope. Each
successive surface is removed by a diamond knife (“serial block face”, [15]) or a
focused ion beam (“FIB-SEM”, [16, 17]). The newly exposed surface is imaged and
the recorded images are aligned in a 3D stack. Serial thin sections and array
tomography is performed by TEM with the consecutive alignment of slices into the
3D-volumes.
The above mentioned methods, sometimes called tomography, allow for the
creation of 3D volumes with anisotropic resolution, however the section-based
methods are not generated by tomographic reconstruction [21] but by assembling
the 3D volumes layer-by-layer. Array tomography, serial block face and FIB-SEM
have a Z-resolution that is determined by the thickness of the section or by the
thickness of the layer erased between the consecutive images. The X-Y resolution is
typically limited by sampling (twice the pixel size) and sample preparation, which
is also dependent on the electron dose per exposure and energy of the applied
electrons.
10.2.2 Imaging Cryo Preserved Samples
Cryo-fixation preserves biological features to atomic details [22] however the
sample becomes radiation sensitive and degrades upon exposure in a
dose-dependent manner [23, 24]. However, additionally to degradation the vitreous
ice moves in a non-isotropic way and may diverge by as much as 6 Å over a
distance of 300 nm and an exposure 35 e
− /Å
2 [25]. This dose is 2–5 times smaller
than is typically used for tomograms used for subtomogram averaging [26],
application of higher dose further increases the anisotropic movement of density.
The resulting tomograms are therefore not generated by imaging “rigid bodies” and
may result in incoherent reconstructions.
The observed contrast between the electron scattering of buffer (mostly H and O
atoms) and of proteins and lipids (mostly O, H, C, N, P) is weak, therefore the
biological samples are called weak phase objects. Limited contrast is enhanced by
defocusing the microscope’s objective lens introducing a non-linear oscillating
contrast transfer function (CTF, Fig. 3.3, Chap. 3).
CTFðsÞ ¼ EðsÞ Ã sinð0:5 à Pi à Cs à L
3
à s
4
À Pi à L à dF à s
2
Þ
ð10:2Þ
where Cs is a spherical lens aberration of the microscope; L—electron wavelength;
s—spatial frequency, dF—applied defocus (negative for underfocus, in
Angstroms). E(s) is an envelope function associated with high resolution information degradation as a result of increasing the defocus. CTF correction must be
performed otherwise the resolution is limited by the frequency of the first zero of
the CTF [26–28] which corresponds to a few to several nanometers.
10 Resolution in Electron Tomography
265