

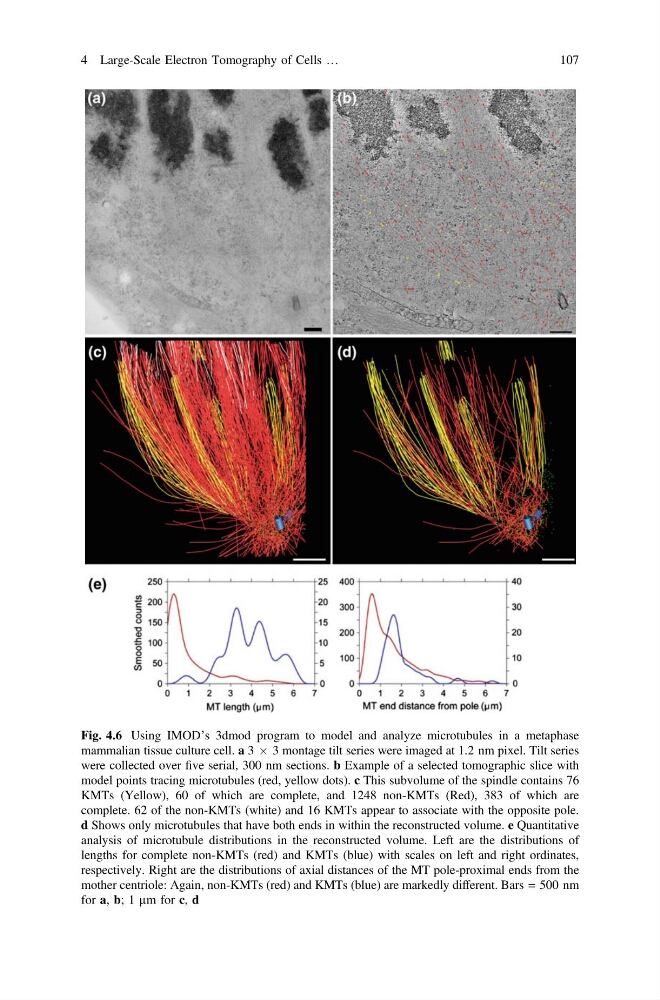
Fig. 4.6 Using IMOD’s 3dmod program to model and analyze microtubules in a metaphase
mammalian tissue culture cell. a 3 Â 3 montage tilt series were imaged at 1.2 nm pixel. Tilt series
were collected over five serial, 300 nm sections. b Example of a selected tomographic slice with
model points tracing microtubules (red, yellow dots). c This subvolume of the spindle contains 76
KMTs (Yellow), 60 of which are complete, and 1248 non-KMTs (Red), 383 of which are
complete. 62 of the non-KMTs (white) and 16 KMTs appear to associate with the opposite pole.
d Shows only microtubules that have both ends in within the reconstructed volume. e Quantitative
analysis of microtubule distributions in the reconstructed volume. Left are the distributions of
lengths for complete non-KMTs (red) and KMTs (blue) with scales on left and right ordinates,
respectively. Right are the distributions of axial distances of the MT pole-proximal ends from the
mother centriole: Again, non-KMTs (red) and KMTs (blue) are markedly different. Bars = 500 nm
for a, b; 1 µm for c, d
4 Large-Scale Electron Tomography of Cells …
107
mammalian tissue culture cell. a 3 Â 3 montage tilt series were imaged at 1.2 nm pixel. Tilt series
were collected over five serial, 300 nm sections. b Example of a selected tomographic slice with
model points tracing microtubules (red, yellow dots). c This subvolume of the spindle contains 76
KMTs (Yellow), 60 of which are complete, and 1248 non-KMTs (Red), 383 of which are
complete. 62 of the non-KMTs (white) and 16 KMTs appear to associate with the opposite pole.
d Shows only microtubules that have both ends in within the reconstructed volume. e Quantitative
analysis of microtubule distributions in the reconstructed volume. Left are the distributions of
lengths for complete non-KMTs (red) and KMTs (blue) with scales on left and right ordinates,
respectively. Right are the distributions of axial distances of the MT pole-proximal ends from the
mother centriole: Again, non-KMTs (red) and KMTs (blue) are markedly different. Bars = 500 nm
for a, b; 1 µm for c, d
4 Large-Scale Electron Tomography of Cells …
107