

minimum overall shift. These transforms are then applied, and all slices are combined into one joined tomogram. The IMOD package has a useful interface for
joining serial section tomograms. A detailed tutorial for its use and a sample data set
can be found at http://bio3d.colorado.edu/imod/doc/JoinTutorial.html.
Similar to most Etomo interfaces, the join interface is divided into tabbed panels:
Setup, Align, Join, Model, Rejoin. The Setup tab contains a table to add tomograms, assign the order with which they will be joined, and identify a range of
sample slices at each surface that will be used for alignment. A range of slices to
include in the final volume is also set here, as well as large or small rotations that
may be needed for stacking volumes properly.
Sample slices are usually aligned with the manual alignment program, Midas.
Although automated alignment is available, sample slices (particularly of smaller
areas) often do not have enough corresponding features for an automated approach
because some material is lost at the surface of the section. Midas allows one to pick
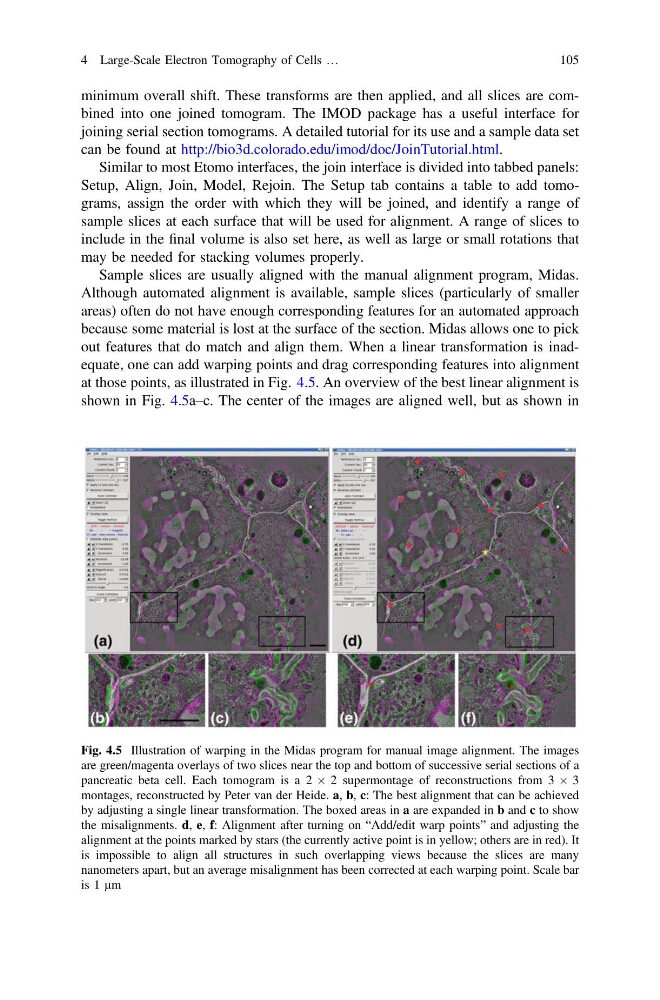
out features that do match and align them. When a linear transformation is inadequate, one can add warping points and drag corresponding features into alignment
at those points, as illustrated in Fig. 4.5. An overview of the best linear alignment is
shown in Fig. 4.5a–c. The center of the images are aligned well, but as shown in
Fig. 4.5 Illustration of warping in the Midas program for manual image alignment. The images
are green/magenta overlays of two slices near the top and bottom of successive serial sections of a
pancreatic beta cell. Each tomogram is a 2 Â 2 supermontage of reconstructions from 3 Â 3
montages, reconstructed by Peter van der Heide. a, b, c: The best alignment that can be achieved
by adjusting a single linear transformation. The boxed areas in a are expanded in b and c to show
the misalignments. d, e, f: Alignment after turning on “Add/edit warp points” and adjusting the
alignment at the points marked by stars (the currently active point is in yellow; others are in red). It
is impossible to align all structures in such overlapping views because the slices are many
nanometers apart, but an average misalignment has been corrected at each warping point. Scale bar
is 1 lm
4 Large-Scale Electron Tomography of Cells …
105
joining serial section tomograms. A detailed tutorial for its use and a sample data set
can be found at http://bio3d.colorado.edu/imod/doc/JoinTutorial.html.
Similar to most Etomo interfaces, the join interface is divided into tabbed panels:
Setup, Align, Join, Model, Rejoin. The Setup tab contains a table to add tomograms, assign the order with which they will be joined, and identify a range of
sample slices at each surface that will be used for alignment. A range of slices to
include in the final volume is also set here, as well as large or small rotations that
may be needed for stacking volumes properly.
Sample slices are usually aligned with the manual alignment program, Midas.
Although automated alignment is available, sample slices (particularly of smaller
areas) often do not have enough corresponding features for an automated approach
because some material is lost at the surface of the section. Midas allows one to pick
out features that do match and align them. When a linear transformation is inadequate, one can add warping points and drag corresponding features into alignment
at those points, as illustrated in Fig. 4.5. An overview of the best linear alignment is
shown in Fig. 4.5a–c. The center of the images are aligned well, but as shown in
Fig. 4.5 Illustration of warping in the Midas program for manual image alignment. The images
are green/magenta overlays of two slices near the top and bottom of successive serial sections of a
pancreatic beta cell. Each tomogram is a 2 Â 2 supermontage of reconstructions from 3 Â 3
montages, reconstructed by Peter van der Heide. a, b, c: The best alignment that can be achieved
by adjusting a single linear transformation. The boxed areas in a are expanded in b and c to show
the misalignments. d, e, f: Alignment after turning on “Add/edit warp points” and adjusting the
alignment at the points marked by stars (the currently active point is in yellow; others are in red). It
is impossible to align all structures in such overlapping views because the slices are many
nanometers apart, but an average misalignment has been corrected at each warping point. Scale bar
is 1 lm
4 Large-Scale Electron Tomography of Cells …
105