

Also, Kong et al. [66] developed a ratiometric case (iii) LRET-based sensor,
which consisted of β-NaYF 4 :Yb,Er UCNP functionalized with fluorescein isothiocyanate (FITC), a pH probe (Fig. 3, Chart 1, Table 1 entry 19), which allowed for the
intracellular pH sensing. The fluorescein pH-dependent absorption affects the
475 nm Tm emission band, while the Tm band at 650 nm remained identical.
Therefore, the response was calculated from the dependence of the I 475 /I 650 ratio
on the pH. The sensor proved to be sensitive, linear in the pH range 3.0–7.0 and
reversible.
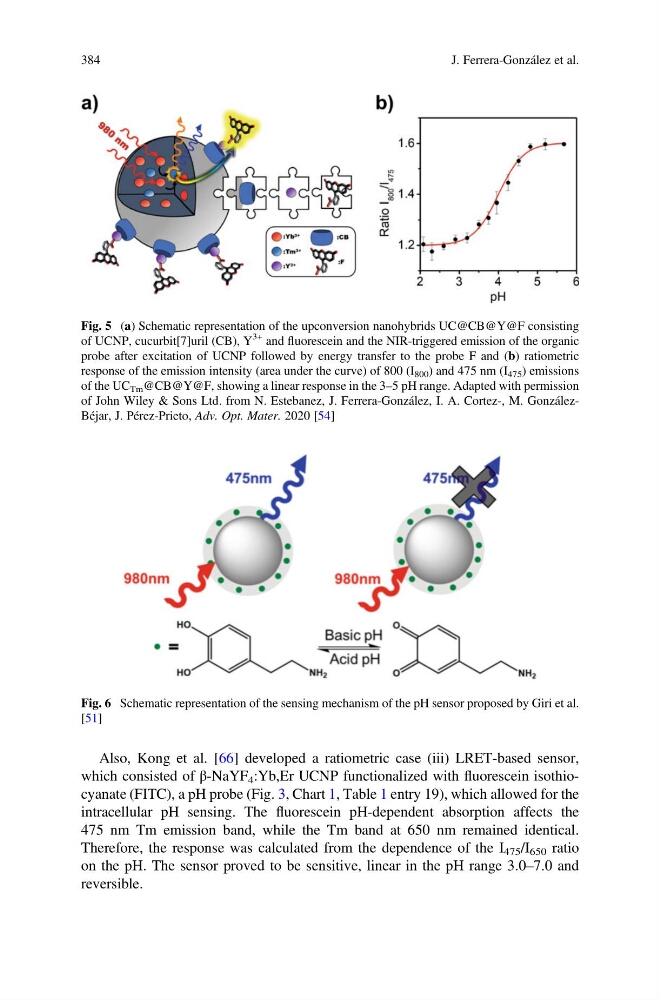
Fig. 5 (a) Schematic representation of the upconversion nanohybrids UC@CB@Y@F consisting
of UCNP, cucurbit[7]uril (CB), Y
3+ and fluorescein and the NIR-triggered emission of the organic
probe after excitation of UCNP followed by energy transfer to the probe F and (b) ratiometric
response of the emission intensity (area under the curve) of 800 (I 800 ) and 475 nm (I 475 ) emissions
of the UC Tm @CB@Y@F, showing a linear response in the 3–5 pH range. Adapted with permission
of John Wiley & Sons Ltd. from N. Estebanez, J. Ferrera-González, I. A. Cortez-, M. GonzálezBéjar, J. Pérez-Prieto, Adv. Opt. Mater. 2020 [54]
Fig. 6 Schematic representation of the sensing mechanism of the pH sensor proposed by Giri et al.
[51]
384
J. Ferrera-González et al.
which consisted of β-NaYF 4 :Yb,Er UCNP functionalized with fluorescein isothiocyanate (FITC), a pH probe (Fig. 3, Chart 1, Table 1 entry 19), which allowed for the
intracellular pH sensing. The fluorescein pH-dependent absorption affects the
475 nm Tm emission band, while the Tm band at 650 nm remained identical.
Therefore, the response was calculated from the dependence of the I 475 /I 650 ratio
on the pH. The sensor proved to be sensitive, linear in the pH range 3.0–7.0 and
reversible.
Fig. 5 (a) Schematic representation of the upconversion nanohybrids UC@CB@Y@F consisting
of UCNP, cucurbit[7]uril (CB), Y
3+ and fluorescein and the NIR-triggered emission of the organic
probe after excitation of UCNP followed by energy transfer to the probe F and (b) ratiometric
response of the emission intensity (area under the curve) of 800 (I 800 ) and 475 nm (I 475 ) emissions
of the UC Tm @CB@Y@F, showing a linear response in the 3–5 pH range. Adapted with permission
of John Wiley & Sons Ltd. from N. Estebanez, J. Ferrera-González, I. A. Cortez-, M. GonzálezBéjar, J. Pérez-Prieto, Adv. Opt. Mater. 2020 [54]
Fig. 6 Schematic representation of the sensing mechanism of the pH sensor proposed by Giri et al.
[51]
384
J. Ferrera-González et al.