

was found to be completely suppressed [23, 24, 29]. In this system, porphyrin was
adsorbed on the surface of saponite at up to 100% vs. the cation exchange capacity of
the clay (CEC) without any aggregation. The absorption spectra of p-TMPyP with a
loading range of 10–150% vs. CEC are shown in Fig. 6. As observed, up to
100% vs. CEC, the spectral shape was the same, indicating non-aggregate formation.
Above 100% vs. CEC, a new band appears in the absorption spectra at shorter
wavelength ascribed to non-adsorbed dye species. When the adsorption rate is
100% vs. CEC, the average intermolecular distance of p-TMPyP is 2.4 nm for a
typical saponite. In addition to absorption behavior, fluorescence does not suffer
concentration quenching in the case of p-TMPyP [33, 34]. The mechanism to
suppress aggregate formation on saponite is rationalized as follows. The interanionic charge distance on the saponite surface is calculated to be 1.2 nm based on
the hexagonal array, and the inter-cationic distance in p-TMPyP is around 1.03 nm.
Because of the good electrostatic matching between saponite and p-TMPyP, the
interaction between saponite and p-TMPyP is quite strong. Therefore, aggregation
between p-TMPyP and p-TMPyP is suppressed (Fig. 7). Because the relative
intercharge charge-matching plays an important role, this mechanism is called the
“size-matching effect” [7, 23–32]. This complex, p-TMPyP, is photochemically
active and subjected to physicochemical observation.
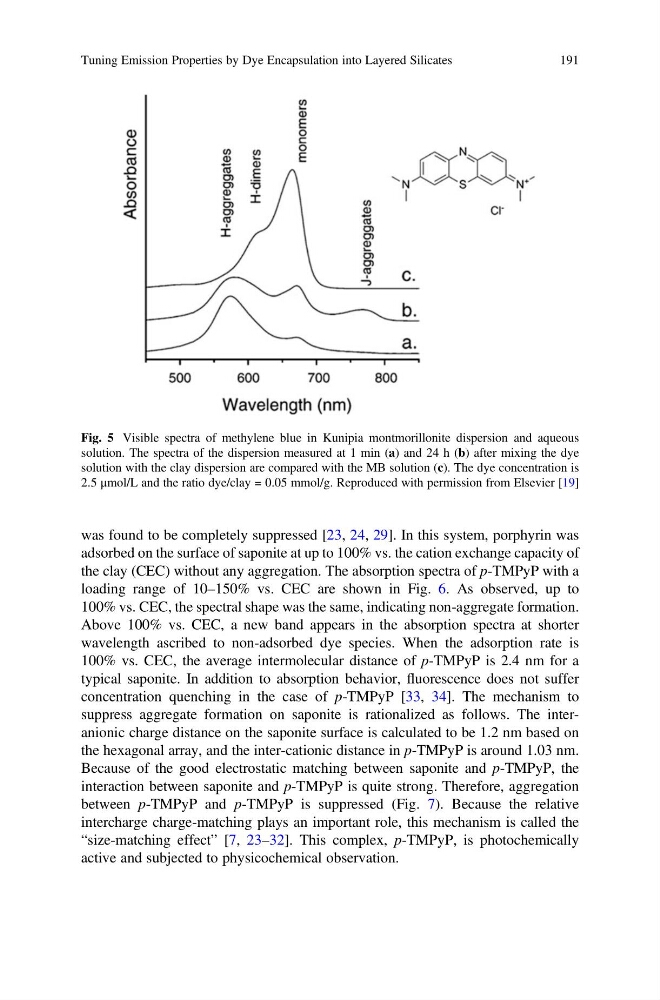
Fig. 5 Visible spectra of methylene blue in Kunipia montmorillonite dispersion and aqueous
solution. The spectra of the dispersion measured at 1 min (a) and 24 h (b) after mixing the dye
solution with the clay dispersion are compared with the MB solution (c). The dye concentration is
2.5 μmol/L and the ratio dye/clay = 0.05 mmol/g. Reproduced with permission from Elsevier [19]
Tuning Emission Properties by Dye Encapsulation into Layered Silicates
191
adsorbed on the surface of saponite at up to 100% vs. the cation exchange capacity of
the clay (CEC) without any aggregation. The absorption spectra of p-TMPyP with a
loading range of 10–150% vs. CEC are shown in Fig. 6. As observed, up to
100% vs. CEC, the spectral shape was the same, indicating non-aggregate formation.
Above 100% vs. CEC, a new band appears in the absorption spectra at shorter
wavelength ascribed to non-adsorbed dye species. When the adsorption rate is
100% vs. CEC, the average intermolecular distance of p-TMPyP is 2.4 nm for a
typical saponite. In addition to absorption behavior, fluorescence does not suffer
concentration quenching in the case of p-TMPyP [33, 34]. The mechanism to
suppress aggregate formation on saponite is rationalized as follows. The interanionic charge distance on the saponite surface is calculated to be 1.2 nm based on
the hexagonal array, and the inter-cationic distance in p-TMPyP is around 1.03 nm.
Because of the good electrostatic matching between saponite and p-TMPyP, the
interaction between saponite and p-TMPyP is quite strong. Therefore, aggregation
between p-TMPyP and p-TMPyP is suppressed (Fig. 7). Because the relative
intercharge charge-matching plays an important role, this mechanism is called the
“size-matching effect” [7, 23–32]. This complex, p-TMPyP, is photochemically
active and subjected to physicochemical observation.
Fig. 5 Visible spectra of methylene blue in Kunipia montmorillonite dispersion and aqueous
solution. The spectra of the dispersion measured at 1 min (a) and 24 h (b) after mixing the dye
solution with the clay dispersion are compared with the MB solution (c). The dye concentration is
2.5 μmol/L and the ratio dye/clay = 0.05 mmol/g. Reproduced with permission from Elsevier [19]
Tuning Emission Properties by Dye Encapsulation into Layered Silicates
191