

reliable estimates of this constant. It is therefore not surprising that affinities determined by different approaches may vary. In order to obtain a robust insight into the
binding strength of two interaction partners and thus to approximate their true K D
value as best as possible, it is mandatory to apply different analytical approaches.
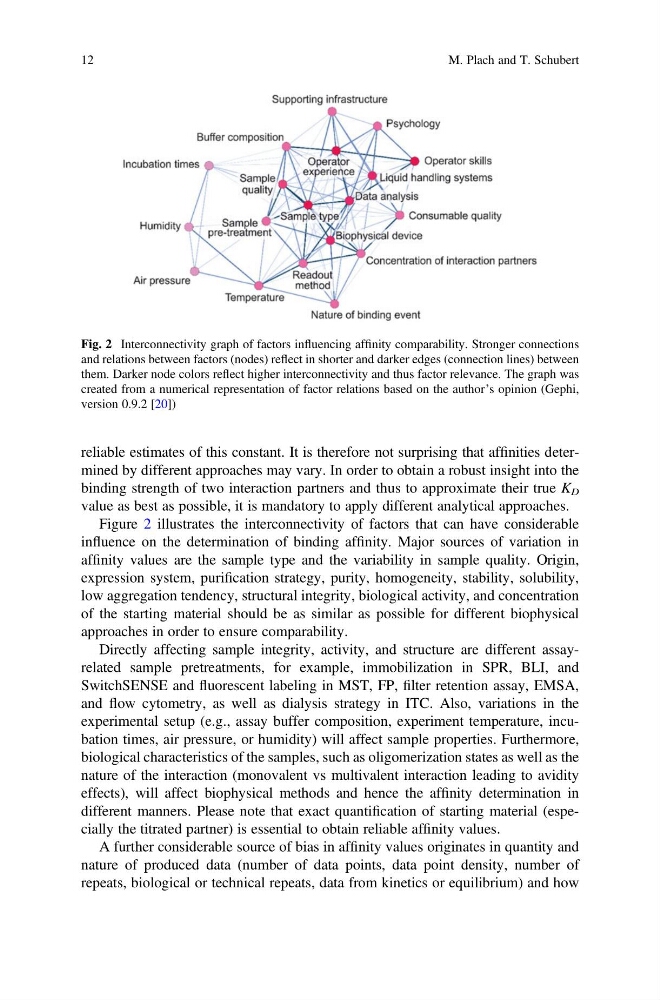
Figure 2 illustrates the interconnectivity of factors that can have considerable
influence on the determination of binding affinity. Major sources of variation in
affinity values are the sample type and the variability in sample quality. Origin,
expression system, purification strategy, purity, homogeneity, stability, solubility,
low aggregation tendency, structural integrity, biological activity, and concentration
of the starting material should be as similar as possible for different biophysical
approaches in order to ensure comparability.
Directly affecting sample integrity, activity, and structure are different assayrelated sample pretreatments, for example, immobilization in SPR, BLI, and
SwitchSENSE and fluorescent labeling in MST, FP, filter retention assay, EMSA,
and flow cytometry, as well as dialysis strategy in ITC. Also, variations in the
experimental setup (e.g., assay buffer composition, experiment temperature, incubation times, air pressure, or humidity) will affect sample properties. Furthermore,
biological characteristics of the samples, such as oligomerization states as well as the
nature of the interaction (monovalent vs multivalent interaction leading to avidity
effects), will affect biophysical methods and hence the affinity determination in
different manners. Please note that exact quantification of starting material (especially the titrated partner) is essential to obtain reliable affinity values.
A further considerable source of bias in affinity values originates in quantity and
nature of produced data (number of data points, data point density, number of
repeats, biological or technical repeats, data from kinetics or equilibrium) and how
Fig. 2 Interconnectivity graph of factors influencing affinity comparability. Stronger connections
and relations between factors (nodes) reflect in shorter and darker edges (connection lines) between
them. Darker node colors reflect higher interconnectivity and thus factor relevance. The graph was
created from a numerical representation of factor relations based on the author’s opinion (Gephi,
version 0.9.2 [20])
12
M. Plach and T. Schubert
binding strength of two interaction partners and thus to approximate their true K D
value as best as possible, it is mandatory to apply different analytical approaches.
Figure 2 illustrates the interconnectivity of factors that can have considerable
influence on the determination of binding affinity. Major sources of variation in
affinity values are the sample type and the variability in sample quality. Origin,
expression system, purification strategy, purity, homogeneity, stability, solubility,
low aggregation tendency, structural integrity, biological activity, and concentration
of the starting material should be as similar as possible for different biophysical
approaches in order to ensure comparability.
Directly affecting sample integrity, activity, and structure are different assayrelated sample pretreatments, for example, immobilization in SPR, BLI, and
SwitchSENSE and fluorescent labeling in MST, FP, filter retention assay, EMSA,
and flow cytometry, as well as dialysis strategy in ITC. Also, variations in the
experimental setup (e.g., assay buffer composition, experiment temperature, incubation times, air pressure, or humidity) will affect sample properties. Furthermore,
biological characteristics of the samples, such as oligomerization states as well as the
nature of the interaction (monovalent vs multivalent interaction leading to avidity
effects), will affect biophysical methods and hence the affinity determination in
different manners. Please note that exact quantification of starting material (especially the titrated partner) is essential to obtain reliable affinity values.
A further considerable source of bias in affinity values originates in quantity and
nature of produced data (number of data points, data point density, number of
repeats, biological or technical repeats, data from kinetics or equilibrium) and how
Fig. 2 Interconnectivity graph of factors influencing affinity comparability. Stronger connections
and relations between factors (nodes) reflect in shorter and darker edges (connection lines) between
them. Darker node colors reflect higher interconnectivity and thus factor relevance. The graph was
created from a numerical representation of factor relations based on the author’s opinion (Gephi,
version 0.9.2 [20])
12
M. Plach and T. Schubert