

conformational change or molecular interaction between the fluorophore and the
acceptor (a quencher or a second fluorophore), depending on the distance. Target
recognition can be the switch to produce this activation and the final emission [70–
73]. Some authors reported the use of conformational changes associated with
aptamer/target binding to generate activatable aptamer probes (AAP)
[72, 74]. When the probe binds to a target, conformational changes separate the
fluorophore from a quencher, resulting in active fluorescence [75].
As an innovative alternative, aptamers are conjugated to quantum dots (QDs),
nanocrystals of semiconductor materials, which have interesting emission properties
[76]. Quantum dots are also used for in vivo imaging. Their narrow and symmetric
emission peaks, obtained by excitation with broad ranges of wavelengths, allow for
multicolored single QDs that enable multimodal imaging [77]. Compared with
conventional fluorescent materials, QDs exhibit more advantages, including water
solubility, high quantum fluorescence yield, low photobleaching, and chemical
stability [78]. Aptamer-QDs are reported to have strong fluorescence and excellent
photostability and have been successfully applied in active tumor-targeted in vivo
imaging [79]. Recently, a nanoprobe constructed with a QD-labeled aptamer was
reported to be capable of binding to the epidermal growth factor receptor variant III
(EGFRvIII) spacially distributed on the surface of glioma cells. The fluorescence
imaging in vivo, using glioma model mice, showed the probe could penetrate the
blood-brain barrier and generate a strong fluorescence on tumors, which contributed
to clearly visualizing the glioma margins [76].
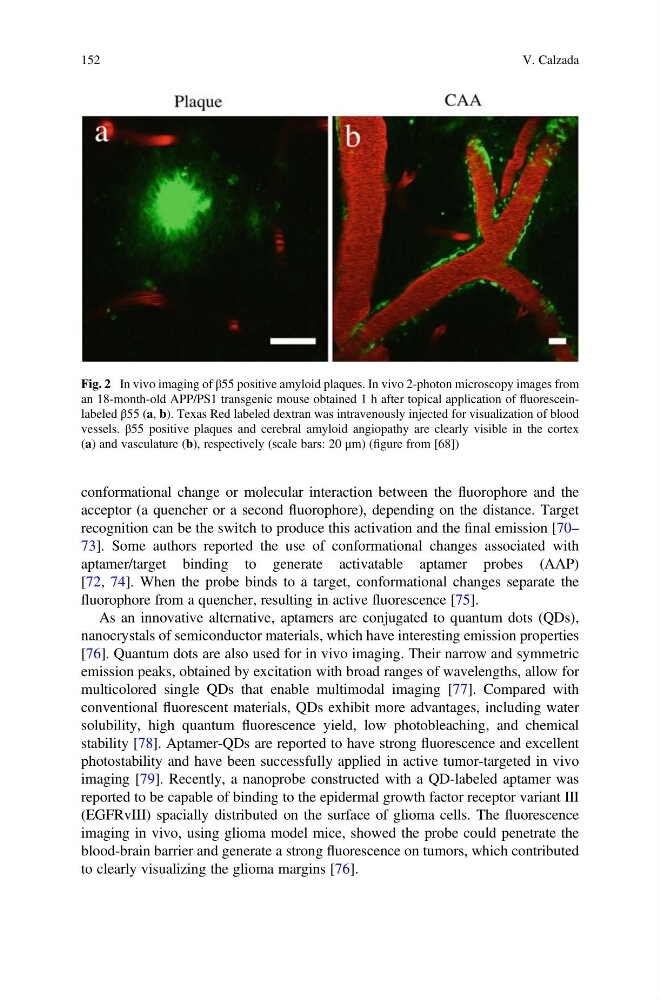
Fig. 2 In vivo imaging of β55 positive amyloid plaques. In vivo 2-photon microscopy images from
an 18-month-old APP/PS1 transgenic mouse obtained 1 h after topical application of fluoresceinlabeled β55 (a, b). Texas Red labeled dextran was intravenously injected for visualization of blood
vessels. β55 positive plaques and cerebral amyloid angiopathy are clearly visible in the cortex
(a) and vasculature (b), respectively (scale bars: 20 μm) (figure from [68])
152
V. Calzada
acceptor (a quencher or a second fluorophore), depending on the distance. Target
recognition can be the switch to produce this activation and the final emission [70–
73]. Some authors reported the use of conformational changes associated with
aptamer/target binding to generate activatable aptamer probes (AAP)
[72, 74]. When the probe binds to a target, conformational changes separate the
fluorophore from a quencher, resulting in active fluorescence [75].
As an innovative alternative, aptamers are conjugated to quantum dots (QDs),
nanocrystals of semiconductor materials, which have interesting emission properties
[76]. Quantum dots are also used for in vivo imaging. Their narrow and symmetric
emission peaks, obtained by excitation with broad ranges of wavelengths, allow for
multicolored single QDs that enable multimodal imaging [77]. Compared with
conventional fluorescent materials, QDs exhibit more advantages, including water
solubility, high quantum fluorescence yield, low photobleaching, and chemical
stability [78]. Aptamer-QDs are reported to have strong fluorescence and excellent
photostability and have been successfully applied in active tumor-targeted in vivo
imaging [79]. Recently, a nanoprobe constructed with a QD-labeled aptamer was
reported to be capable of binding to the epidermal growth factor receptor variant III
(EGFRvIII) spacially distributed on the surface of glioma cells. The fluorescence
imaging in vivo, using glioma model mice, showed the probe could penetrate the
blood-brain barrier and generate a strong fluorescence on tumors, which contributed
to clearly visualizing the glioma margins [76].
Fig. 2 In vivo imaging of β55 positive amyloid plaques. In vivo 2-photon microscopy images from
an 18-month-old APP/PS1 transgenic mouse obtained 1 h after topical application of fluoresceinlabeled β55 (a, b). Texas Red labeled dextran was intravenously injected for visualization of blood
vessels. β55 positive plaques and cerebral amyloid angiopathy are clearly visible in the cortex
(a) and vasculature (b), respectively (scale bars: 20 μm) (figure from [68])
152
V. Calzada