

64
P. Sjödin et al.
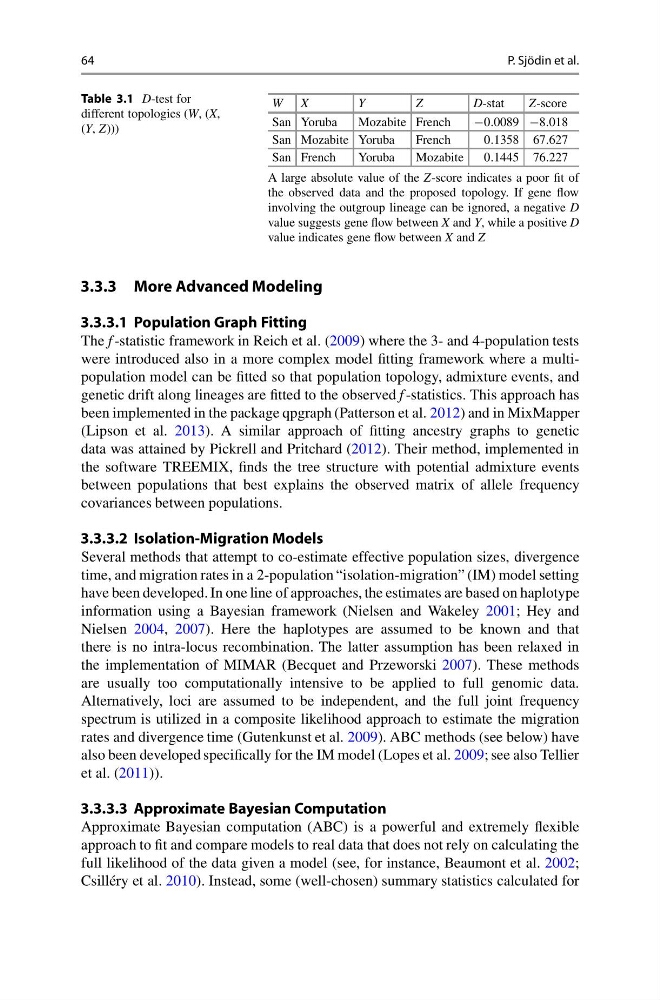
Table 3.1 D-test for
different topologies (W, (X,
(Y, Z)))
W X
Y
Z
D-stat
Z-score
San Yoruba
Mozabite French
−0.0089 −8.018
San Mozabite Yoruba
French
0.1358 67.627
San French
Yoruba
Mozabite
0.1445 76.227
A large absolute value of the Z-score indicates a poor fit of
the observed data and the proposed topology. If gene flow
involving the outgroup lineage can be ignored, a negative D
value suggests gene flow between X and Y, while a positive D
value indicates gene flow between X and Z
3.3.3 More Advanced Modeling
3.3.3.1 Population Graph Fitting
The f -statistic framework in Reich et al. (2009) where the 3- and 4-population tests
were introduced also in a more complex model fitting framework where a multipopulation model can be fitted so that population topology, admixture events, and
genetic drift along lineages are fitted to the observed f -statistics. This approach has
been implemented in the package qpgraph (Patterson et al. 2012) and in MixMapper
(Lipson et al. 2013). A similar approach of fitting ancestry graphs to genetic
data was attained by Pickrell and Pritchard (2012). Their method, implemented in
the software TREEMIX, finds the tree structure with potential admixture events
between populations that best explains the observed matrix of allele frequency
covariances between populations.
3.3.3.2 Isolation-Migration Models
Several methods that attempt to co-estimate effective population sizes, divergence
time, and migration rates in a 2-population “isolation-migration” (IM) model setting
have been developed. In one line of approaches, the estimates are based on haplotype
information using a Bayesian framework (Nielsen and Wakeley 2001; Hey and
Nielsen 2004, 2007). Here the haplotypes are assumed to be known and that
there is no intra-locus recombination. The latter assumption has been relaxed in
the implementation of MIMAR (Becquet and Przeworski 2007). These methods
are usually too computationally intensive to be applied to full genomic data.
Alternatively, loci are assumed to be independent, and the full joint frequency
spectrum is utilized in a composite likelihood approach to estimate the migration
rates and divergence time (Gutenkunst et al. 2009). ABC methods (see below) have
also been developed specifically for the IM model (Lopes et al. 2009; see also Tellier
et al. (2011)).
3.3.3.3 Approximate Bayesian Computation
Approximate Bayesian computation (ABC) is a powerful and extremely flexible
approach to fit and compare models to real data that does not rely on calculating the
full likelihood of the data given a model (see, for instance, Beaumont et al. 2002;
Csilléry et al. 2010). Instead, some (well-chosen) summary statistics calculated for
P. Sjödin et al.
Table 3.1 D-test for
different topologies (W, (X,
(Y, Z)))
W X
Y
Z
D-stat
Z-score
San Yoruba
Mozabite French
−0.0089 −8.018
San Mozabite Yoruba
French
0.1358 67.627
San French
Yoruba
Mozabite
0.1445 76.227
A large absolute value of the Z-score indicates a poor fit of
the observed data and the proposed topology. If gene flow
involving the outgroup lineage can be ignored, a negative D
value suggests gene flow between X and Y, while a positive D
value indicates gene flow between X and Z
3.3.3 More Advanced Modeling
3.3.3.1 Population Graph Fitting
The f -statistic framework in Reich et al. (2009) where the 3- and 4-population tests
were introduced also in a more complex model fitting framework where a multipopulation model can be fitted so that population topology, admixture events, and
genetic drift along lineages are fitted to the observed f -statistics. This approach has
been implemented in the package qpgraph (Patterson et al. 2012) and in MixMapper
(Lipson et al. 2013). A similar approach of fitting ancestry graphs to genetic
data was attained by Pickrell and Pritchard (2012). Their method, implemented in
the software TREEMIX, finds the tree structure with potential admixture events
between populations that best explains the observed matrix of allele frequency
covariances between populations.
3.3.3.2 Isolation-Migration Models
Several methods that attempt to co-estimate effective population sizes, divergence
time, and migration rates in a 2-population “isolation-migration” (IM) model setting
have been developed. In one line of approaches, the estimates are based on haplotype
information using a Bayesian framework (Nielsen and Wakeley 2001; Hey and
Nielsen 2004, 2007). Here the haplotypes are assumed to be known and that
there is no intra-locus recombination. The latter assumption has been relaxed in
the implementation of MIMAR (Becquet and Przeworski 2007). These methods
are usually too computationally intensive to be applied to full genomic data.
Alternatively, loci are assumed to be independent, and the full joint frequency
spectrum is utilized in a composite likelihood approach to estimate the migration
rates and divergence time (Gutenkunst et al. 2009). ABC methods (see below) have
also been developed specifically for the IM model (Lopes et al. 2009; see also Tellier
et al. (2011)).
3.3.3.3 Approximate Bayesian Computation
Approximate Bayesian computation (ABC) is a powerful and extremely flexible
approach to fit and compare models to real data that does not rely on calculating the
full likelihood of the data given a model (see, for instance, Beaumont et al. 2002;
Csilléry et al. 2010). Instead, some (well-chosen) summary statistics calculated for