

58
P. Sjödin et al.
K=4
K=2
K=3
S a n
Y o r u b a
M
o z a b i t e
F r e n c h
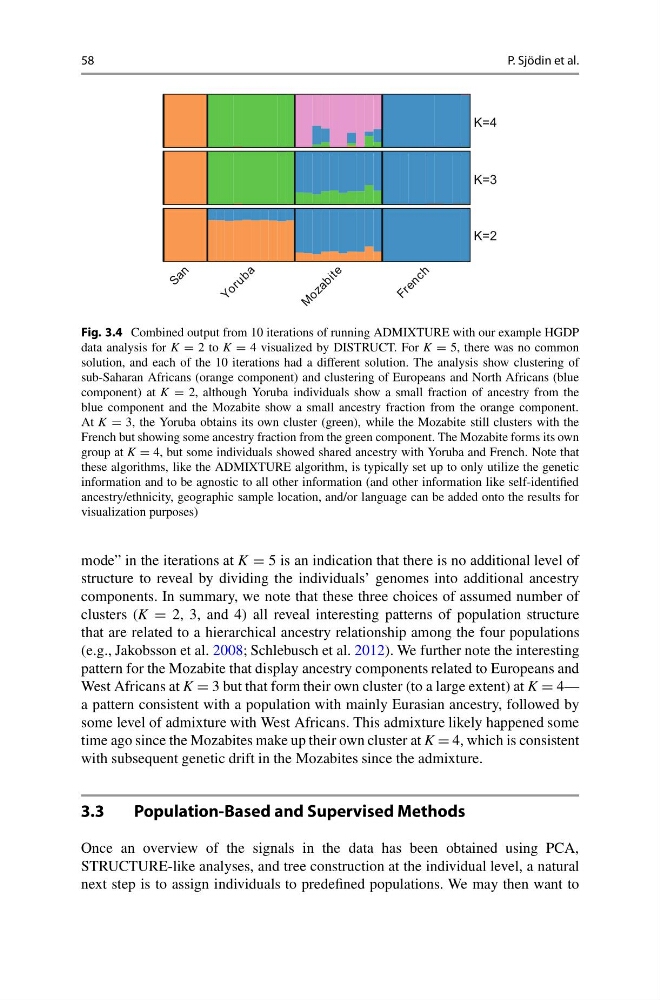
Fig. 3.4 Combined output from 10 iterations of running ADMIXTURE with our example HGDP
data analysis for K = 2 to K = 4 visualized by DISTRUCT. For K = 5, there was no common
solution, and each of the 10 iterations had a different solution. The analysis show clustering of
sub-Saharan Africans (orange component) and clustering of Europeans and North Africans (blue
component) at K = 2, although Yoruba individuals show a small fraction of ancestry from the
blue component and the Mozabite show a small ancestry fraction from the orange component.
At K = 3, the Yoruba obtains its own cluster (green), while the Mozabite still clusters with the
French but showing some ancestry fraction from the green component. The Mozabite forms its own
group at K = 4, but some individuals showed shared ancestry with Yoruba and French. Note that
these algorithms, like the ADMIXTURE algorithm, is typically set up to only utilize the genetic
information and to be agnostic to all other information (and other information like self-identified
ancestry/ethnicity, geographic sample location, and/or language can be added onto the results for
visualization purposes)
mode” in the iterations at K = 5 is an indication that there is no additional level of
structure to reveal by dividing the individuals’ genomes into additional ancestry
components. In summary, we note that these three choices of assumed number of
clusters (K = 2, 3, and 4) all reveal interesting patterns of population structure
that are related to a hierarchical ancestry relationship among the four populations
(e.g., Jakobsson et al. 2008; Schlebusch et al. 2012). We further note the interesting
pattern for the Mozabite that display ancestry components related to Europeans and
West Africans at K = 3 but that form their own cluster (to a large extent) at K = 4—
a pattern consistent with a population with mainly Eurasian ancestry, followed by
some level of admixture with West Africans. This admixture likely happened some
time ago since the Mozabites make up their own cluster at K = 4, which is consistent
with subsequent genetic drift in the Mozabites since the admixture.
3.3
Population-Based and Supervised Methods
Once an overview of the signals in the data has been obtained using PCA,
STRUCTURE-like analyses, and tree construction at the individual level, a natural
next step is to assign individuals to predefined populations. We may then want to
P. Sjödin et al.
K=4
K=2
K=3
S a n
Y o r u b a
M
o z a b i t e
F r e n c h
Fig. 3.4 Combined output from 10 iterations of running ADMIXTURE with our example HGDP
data analysis for K = 2 to K = 4 visualized by DISTRUCT. For K = 5, there was no common
solution, and each of the 10 iterations had a different solution. The analysis show clustering of
sub-Saharan Africans (orange component) and clustering of Europeans and North Africans (blue
component) at K = 2, although Yoruba individuals show a small fraction of ancestry from the
blue component and the Mozabite show a small ancestry fraction from the orange component.
At K = 3, the Yoruba obtains its own cluster (green), while the Mozabite still clusters with the
French but showing some ancestry fraction from the green component. The Mozabite forms its own
group at K = 4, but some individuals showed shared ancestry with Yoruba and French. Note that
these algorithms, like the ADMIXTURE algorithm, is typically set up to only utilize the genetic
information and to be agnostic to all other information (and other information like self-identified
ancestry/ethnicity, geographic sample location, and/or language can be added onto the results for
visualization purposes)
mode” in the iterations at K = 5 is an indication that there is no additional level of
structure to reveal by dividing the individuals’ genomes into additional ancestry
components. In summary, we note that these three choices of assumed number of
clusters (K = 2, 3, and 4) all reveal interesting patterns of population structure
that are related to a hierarchical ancestry relationship among the four populations
(e.g., Jakobsson et al. 2008; Schlebusch et al. 2012). We further note the interesting
pattern for the Mozabite that display ancestry components related to Europeans and
West Africans at K = 3 but that form their own cluster (to a large extent) at K = 4—
a pattern consistent with a population with mainly Eurasian ancestry, followed by
some level of admixture with West Africans. This admixture likely happened some
time ago since the Mozabites make up their own cluster at K = 4, which is consistent
with subsequent genetic drift in the Mozabites since the admixture.
3.3
Population-Based and Supervised Methods
Once an overview of the signals in the data has been obtained using PCA,
STRUCTURE-like analyses, and tree construction at the individual level, a natural
next step is to assign individuals to predefined populations. We may then want to