

22
J. Wakeley
A
B
C
D
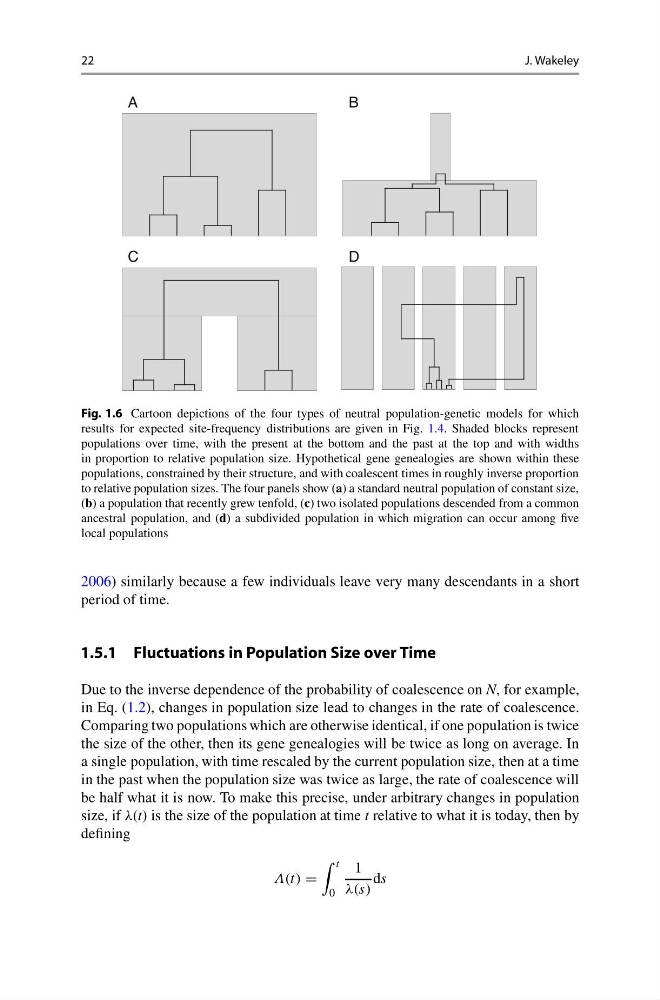
Fig. 1.6 Cartoon depictions of the four types of neutral population-genetic models for which
results for expected site-frequency distributions are given in Fig. 1.4. Shaded blocks represent
populations over time, with the present at the bottom and the past at the top and with widths
in proportion to relative population size. Hypothetical gene genealogies are shown within these
populations, constrained by their structure, and with coalescent times in roughly inverse proportion
to relative population sizes. The four panels show (a) a standard neutral population of constant size,
(b) a population that recently grew tenfold, (c) two isolated populations descended from a common
ancestral population, and (d) a subdivided population in which migration can occur among five
local populations
2006) similarly because a few individuals leave very many descendants in a short
period of time.
1.5.1 Fluctuations in Population Size over Time
Due to the inverse dependence of the probability of coalescence on N, for example,
in Eq. (1.2), changes in population size lead to changes in the rate of coalescence.
Comparing two populations which are otherwise identical, if one population is twice
the size of the other, then its gene genealogies will be twice as long on average. In
a single population, with time rescaled by the current population size, then at a time
in the past when the population size was twice as large, the rate of coalescence will
be half what it is now. To make this precise, under arbitrary changes in population
size, if λ(t) is the size of the population at time t relative to what it is today, then by
defining
Λ(t) =
t
0
1
λ(s)
ds
J. Wakeley
A
B
C
D
Fig. 1.6 Cartoon depictions of the four types of neutral population-genetic models for which
results for expected site-frequency distributions are given in Fig. 1.4. Shaded blocks represent
populations over time, with the present at the bottom and the past at the top and with widths
in proportion to relative population size. Hypothetical gene genealogies are shown within these
populations, constrained by their structure, and with coalescent times in roughly inverse proportion
to relative population sizes. The four panels show (a) a standard neutral population of constant size,
(b) a population that recently grew tenfold, (c) two isolated populations descended from a common
ancestral population, and (d) a subdivided population in which migration can occur among five
local populations
2006) similarly because a few individuals leave very many descendants in a short
period of time.
1.5.1 Fluctuations in Population Size over Time
Due to the inverse dependence of the probability of coalescence on N, for example,
in Eq. (1.2), changes in population size lead to changes in the rate of coalescence.
Comparing two populations which are otherwise identical, if one population is twice
the size of the other, then its gene genealogies will be twice as long on average. In
a single population, with time rescaled by the current population size, then at a time
in the past when the population size was twice as large, the rate of coalescence will
be half what it is now. To make this precise, under arbitrary changes in population
size, if λ(t) is the size of the population at time t relative to what it is today, then by
defining
Λ(t) =
t
0
1
λ(s)
ds