

224
L. S. Emery and J. M. Akey
a
e
d
c
b
F ST at
slected
site(s)
F ST at
linked
neutral
sites
New mutation spread by migration
Shared standing variation
Population-specific standing variation
Selection in different directions in two populations
Selection in one population
Selection in the same direction in two populations
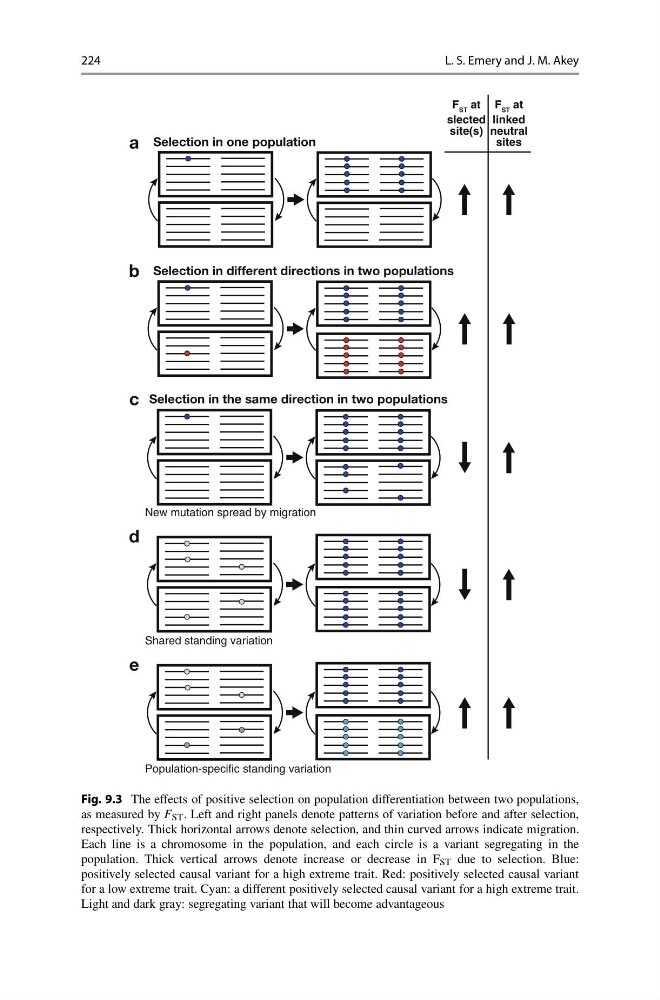
Fig. 9.3 The effects of positive selection on population differentiation between two populations,
as measured by F ST . Left and right panels denote patterns of variation before and after selection,
respectively. Thick horizontal arrows denote selection, and thin curved arrows indicate migration.
Each line is a chromosome in the population, and each circle is a variant segregating in the
population. Thick vertical arrows denote increase or decrease in F ST due to selection. Blue:
positively selected causal variant for a high extreme trait. Red: positively selected causal variant
for a low extreme trait. Cyan: a different positively selected causal variant for a high extreme trait.
Light and dark gray: segregating variant that will become advantageous
L. S. Emery and J. M. Akey
a
e
d
c
b
F ST at
slected
site(s)
F ST at
linked
neutral
sites
New mutation spread by migration
Shared standing variation
Population-specific standing variation
Selection in different directions in two populations
Selection in one population
Selection in the same direction in two populations
Fig. 9.3 The effects of positive selection on population differentiation between two populations,
as measured by F ST . Left and right panels denote patterns of variation before and after selection,
respectively. Thick horizontal arrows denote selection, and thin curved arrows indicate migration.
Each line is a chromosome in the population, and each circle is a variant segregating in the
population. Thick vertical arrows denote increase or decrease in F ST due to selection. Blue:
positively selected causal variant for a high extreme trait. Red: positively selected causal variant
for a low extreme trait. Cyan: a different positively selected causal variant for a high extreme trait.
Light and dark gray: segregating variant that will become advantageous