

212
L. S. Emery and J. M. Akey
position (hg19)
CEU
0
1
2
3
4
5
|iHS|
YRI
0
1
2
3
4
5
136,750,000
136,500,000
136,550,000
136,600,000
136,650,000
136,700,000
CEU
0.00
0.50
1.00
F
ST
YRI
0.00
0.50
1.00
136,750,000
136,500,000
136,550,000
136,600,000
136,650,000
136,700,000
UBXN4
LCT
LOC100507600
MCM6
136,750,000
136,500,000
136,550,000
136,600,000
136,650,000
136,700,000
DARS
Chromosome 2
a
b
c
+
-
Strand
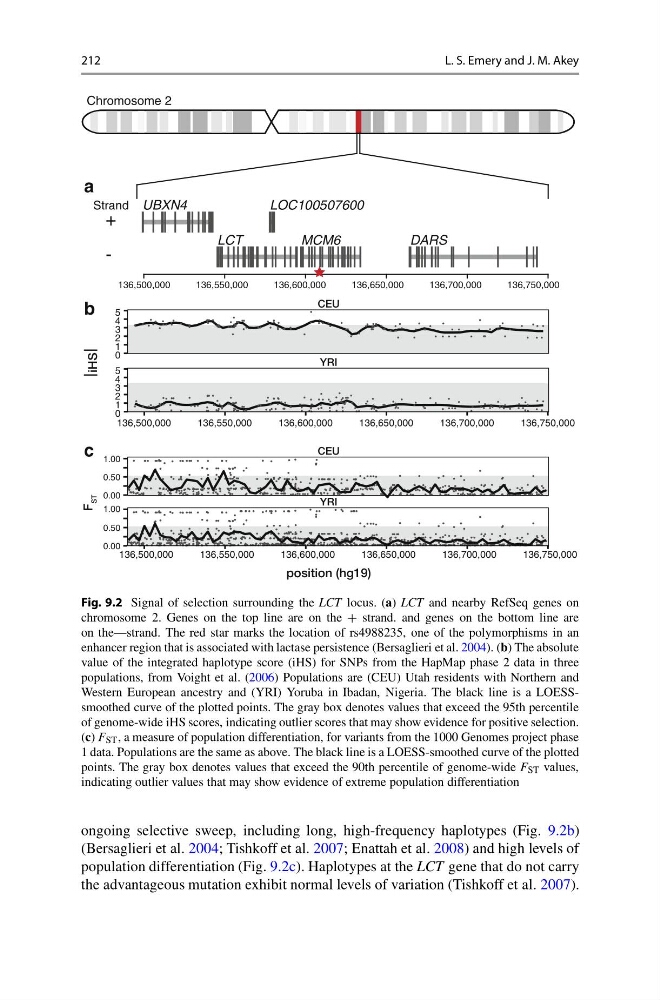
Fig. 9.2 Signal of selection surrounding the LCT locus. (a) LCT and nearby RefSeq genes on
chromosome 2. Genes on the top line are on the + strand. and genes on the bottom line are
on the—strand. The red star marks the location of rs4988235, one of the polymorphisms in an
enhancer region that is associated with lactase persistence (Bersaglieri et al. 2004). (b) The absolute
value of the integrated haplotype score (iHS) for SNPs from the HapMap phase 2 data in three
populations, from Voight et al. (2006) Populations are (CEU) Utah residents with Northern and
Western European ancestry and (YRI) Yoruba in Ibadan, Nigeria. The black line is a LOESSsmoothed curve of the plotted points. The gray box denotes values that exceed the 95th percentile
of genome-wide iHS scores, indicating outlier scores that may show evidence for positive selection.
(c) F ST , a measure of population differentiation, for variants from the 1000 Genomes project phase
1 data. Populations are the same as above. The black line is a LOESS-smoothed curve of the plotted
points. The gray box denotes values that exceed the 90th percentile of genome-wide F ST values,
indicating outlier values that may show evidence of extreme population differentiation
ongoing selective sweep, including long, high-frequency haplotypes (Fig. 9.2b)
(Bersaglieri et al. 2004; Tishkoff et al. 2007; Enattah et al. 2008) and high levels of
population differentiation (Fig. 9.2c). Haplotypes at the LCT gene that do not carry
the advantageous mutation exhibit normal levels of variation (Tishkoff et al. 2007).
L. S. Emery and J. M. Akey
position (hg19)
CEU
0
1
2
3
4
5
|iHS|
YRI
0
1
2
3
4
5
136,750,000
136,500,000
136,550,000
136,600,000
136,650,000
136,700,000
CEU
0.00
0.50
1.00
F
ST
YRI
0.00
0.50
1.00
136,750,000
136,500,000
136,550,000
136,600,000
136,650,000
136,700,000
UBXN4
LCT
LOC100507600
MCM6
136,750,000
136,500,000
136,550,000
136,600,000
136,650,000
136,700,000
DARS
Chromosome 2
a
b
c
+
-
Strand
Fig. 9.2 Signal of selection surrounding the LCT locus. (a) LCT and nearby RefSeq genes on
chromosome 2. Genes on the top line are on the + strand. and genes on the bottom line are
on the—strand. The red star marks the location of rs4988235, one of the polymorphisms in an
enhancer region that is associated with lactase persistence (Bersaglieri et al. 2004). (b) The absolute
value of the integrated haplotype score (iHS) for SNPs from the HapMap phase 2 data in three
populations, from Voight et al. (2006) Populations are (CEU) Utah residents with Northern and
Western European ancestry and (YRI) Yoruba in Ibadan, Nigeria. The black line is a LOESSsmoothed curve of the plotted points. The gray box denotes values that exceed the 95th percentile
of genome-wide iHS scores, indicating outlier scores that may show evidence for positive selection.
(c) F ST , a measure of population differentiation, for variants from the 1000 Genomes project phase
1 data. Populations are the same as above. The black line is a LOESS-smoothed curve of the plotted
points. The gray box denotes values that exceed the 90th percentile of genome-wide F ST values,
indicating outlier values that may show evidence of extreme population differentiation
ongoing selective sweep, including long, high-frequency haplotypes (Fig. 9.2b)
(Bersaglieri et al. 2004; Tishkoff et al. 2007; Enattah et al. 2008) and high levels of
population differentiation (Fig. 9.2c). Haplotypes at the LCT gene that do not carry
the advantageous mutation exhibit normal levels of variation (Tishkoff et al. 2007).