

194
J. D. Wall
Table 8.1 Comparison of demographic estimates (with confidence intervals in parentheses) from
Gutenkunst et al. (2009), Gravel et al. (2011), Malaspinas et al. (2016), and Steinrücken et al.
(2019)
Parameter
Gutenkunst
Gravel
Malaspinas
Steinrücken
T EU-AS
21.2 (17.2–26.5)
23 (21–27)
42 (29–55)
54 (52–55)
T EU-AF
140 (40–270)
51 (45–69)
127 (83–171)
NA
m EU-AS
9.6 (2.3–17.4)
3.1 (1.8–3.9)
2.2–3.6 (1.4–6.5)
NA
T PAP-AS
NA
NA
58 (51–72)
113 (110–115)
Here T EU-AS refers to the split time between European and East Asian populations, T EU-AF refers
to the split time between European and West African populations, m EU-AS refers to the migration
rate (×10 −5 ) between European and East Asian populations, and T PAP-AS refers to the split time
between Papuan and East Asian populations. NA refers to parameters that were not calculated.
Note that Steinrücken have a different parameterization for gene flow between European and East
Asian populations which is not directly comparable to the migration rates of the other studies
important component of the data (LD). Application of these methods to human
data have generally focused on the demographic history of continental European,
East Asian, and West African populations (e.g., Gutenkunst et al. 2009; Gravel et
al. 2011; Malaspinas et al. 2016) and occasionally between European, East Asian,
and Melanesian populations (Malaspinas et al. 2016; Steinrücken et al. 2019). The
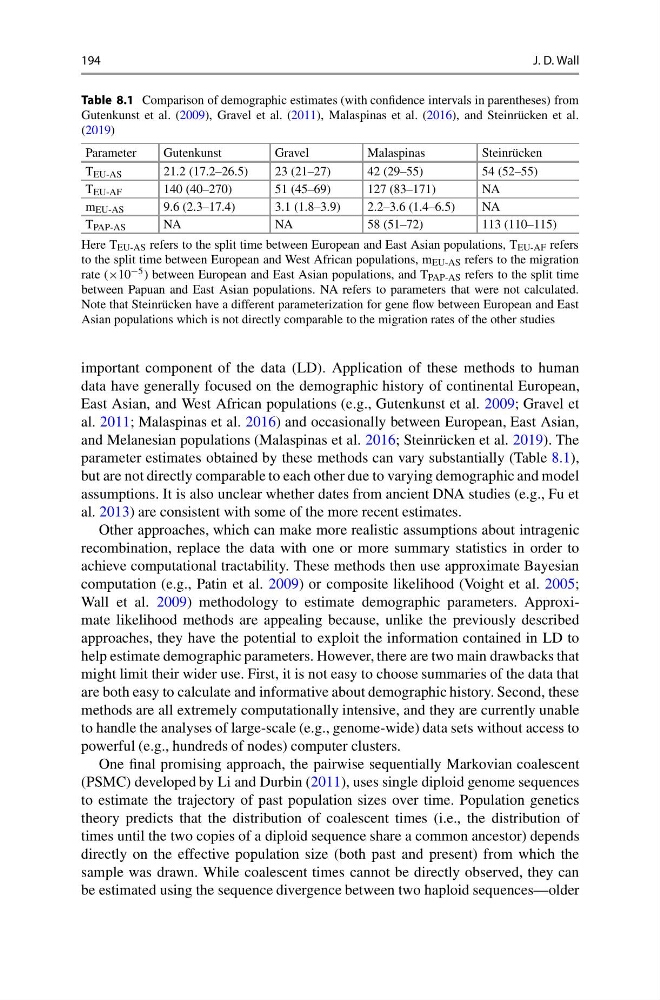
parameter estimates obtained by these methods can vary substantially (Table 8.1),
but are not directly comparable to each other due to varying demographic and model
assumptions. It is also unclear whether dates from ancient DNA studies (e.g., Fu et
al. 2013) are consistent with some of the more recent estimates.
Other approaches, which can make more realistic assumptions about intragenic
recombination, replace the data with one or more summary statistics in order to
achieve computational tractability. These methods then use approximate Bayesian
computation (e.g., Patin et al. 2009) or composite likelihood (Voight et al. 2005;
Wall et al. 2009) methodology to estimate demographic parameters. Approximate likelihood methods are appealing because, unlike the previously described
approaches, they have the potential to exploit the information contained in LD to
help estimate demographic parameters. However, there are two main drawbacks that
might limit their wider use. First, it is not easy to choose summaries of the data that
are both easy to calculate and informative about demographic history. Second, these
methods are all extremely computationally intensive, and they are currently unable
to handle the analyses of large-scale (e.g., genome-wide) data sets without access to
powerful (e.g., hundreds of nodes) computer clusters.
One final promising approach, the pairwise sequentially Markovian coalescent
(PSMC) developed by Li and Durbin (2011), uses single diploid genome sequences
to estimate the trajectory of past population sizes over time. Population genetics
theory predicts that the distribution of coalescent times (i.e., the distribution of
times until the two copies of a diploid sequence share a common ancestor) depends
directly on the effective population size (both past and present) from which the
sample was drawn. While coalescent times cannot be directly observed, they can
be estimated using the sequence divergence between two haploid sequences—older
J. D. Wall
Table 8.1 Comparison of demographic estimates (with confidence intervals in parentheses) from
Gutenkunst et al. (2009), Gravel et al. (2011), Malaspinas et al. (2016), and Steinrücken et al.
(2019)
Parameter
Gutenkunst
Gravel
Malaspinas
Steinrücken
T EU-AS
21.2 (17.2–26.5)
23 (21–27)
42 (29–55)
54 (52–55)
T EU-AF
140 (40–270)
51 (45–69)
127 (83–171)
NA
m EU-AS
9.6 (2.3–17.4)
3.1 (1.8–3.9)
2.2–3.6 (1.4–6.5)
NA
T PAP-AS
NA
NA
58 (51–72)
113 (110–115)
Here T EU-AS refers to the split time between European and East Asian populations, T EU-AF refers
to the split time between European and West African populations, m EU-AS refers to the migration
rate (×10 −5 ) between European and East Asian populations, and T PAP-AS refers to the split time
between Papuan and East Asian populations. NA refers to parameters that were not calculated.
Note that Steinrücken have a different parameterization for gene flow between European and East
Asian populations which is not directly comparable to the migration rates of the other studies
important component of the data (LD). Application of these methods to human
data have generally focused on the demographic history of continental European,
East Asian, and West African populations (e.g., Gutenkunst et al. 2009; Gravel et
al. 2011; Malaspinas et al. 2016) and occasionally between European, East Asian,
and Melanesian populations (Malaspinas et al. 2016; Steinrücken et al. 2019). The
parameter estimates obtained by these methods can vary substantially (Table 8.1),
but are not directly comparable to each other due to varying demographic and model
assumptions. It is also unclear whether dates from ancient DNA studies (e.g., Fu et
al. 2013) are consistent with some of the more recent estimates.
Other approaches, which can make more realistic assumptions about intragenic
recombination, replace the data with one or more summary statistics in order to
achieve computational tractability. These methods then use approximate Bayesian
computation (e.g., Patin et al. 2009) or composite likelihood (Voight et al. 2005;
Wall et al. 2009) methodology to estimate demographic parameters. Approximate likelihood methods are appealing because, unlike the previously described
approaches, they have the potential to exploit the information contained in LD to
help estimate demographic parameters. However, there are two main drawbacks that
might limit their wider use. First, it is not easy to choose summaries of the data that
are both easy to calculate and informative about demographic history. Second, these
methods are all extremely computationally intensive, and they are currently unable
to handle the analyses of large-scale (e.g., genome-wide) data sets without access to
powerful (e.g., hundreds of nodes) computer clusters.
One final promising approach, the pairwise sequentially Markovian coalescent
(PSMC) developed by Li and Durbin (2011), uses single diploid genome sequences
to estimate the trajectory of past population sizes over time. Population genetics
theory predicts that the distribution of coalescent times (i.e., the distribution of
times until the two copies of a diploid sequence share a common ancestor) depends
directly on the effective population size (both past and present) from which the
sample was drawn. While coalescent times cannot be directly observed, they can
be estimated using the sequence divergence between two haploid sequences—older