

7 What Have We Learned from GWAS?
167
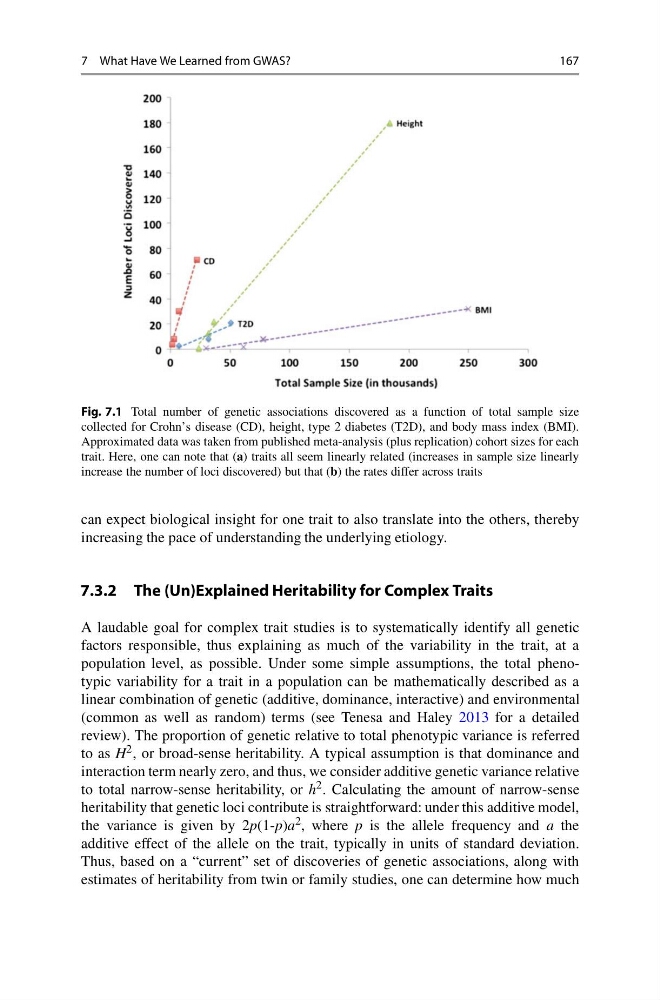
Fig. 7.1 Total number of genetic associations discovered as a function of total sample size
collected for Crohn’s disease (CD), height, type 2 diabetes (T2D), and body mass index (BMI).
Approximated data was taken from published meta-analysis (plus replication) cohort sizes for each
trait. Here, one can note that (a) traits all seem linearly related (increases in sample size linearly
increase the number of loci discovered) but that (b) the rates differ across traits
can expect biological insight for one trait to also translate into the others, thereby
increasing the pace of understanding the underlying etiology.
7.3.2 The (Un)Explained Heritability for Complex Traits
A laudable goal for complex trait studies is to systematically identify all genetic
factors responsible, thus explaining as much of the variability in the trait, at a
population level, as possible. Under some simple assumptions, the total phenotypic variability for a trait in a population can be mathematically described as a
linear combination of genetic (additive, dominance, interactive) and environmental
(common as well as random) terms (see Tenesa and Haley 2013 for a detailed
review). The proportion of genetic relative to total phenotypic variance is referred
to as H 2 , or broad-sense heritability. A typical assumption is that dominance and
interaction term nearly zero, and thus, we consider additive genetic variance relative
to total narrow-sense heritability, or h 2 . Calculating the amount of narrow-sense
heritability that genetic loci contribute is straightforward: under this additive model,
the variance is given by 2p(1-p)a 2 , where p is the allele frequency and a the
additive effect of the allele on the trait, typically in units of standard deviation.
Thus, based on a “current” set of discoveries of genetic associations, along with
estimates of heritability from twin or family studies, one can determine how much
167
Fig. 7.1 Total number of genetic associations discovered as a function of total sample size
collected for Crohn’s disease (CD), height, type 2 diabetes (T2D), and body mass index (BMI).
Approximated data was taken from published meta-analysis (plus replication) cohort sizes for each
trait. Here, one can note that (a) traits all seem linearly related (increases in sample size linearly
increase the number of loci discovered) but that (b) the rates differ across traits
can expect biological insight for one trait to also translate into the others, thereby
increasing the pace of understanding the underlying etiology.
7.3.2 The (Un)Explained Heritability for Complex Traits
A laudable goal for complex trait studies is to systematically identify all genetic
factors responsible, thus explaining as much of the variability in the trait, at a
population level, as possible. Under some simple assumptions, the total phenotypic variability for a trait in a population can be mathematically described as a
linear combination of genetic (additive, dominance, interactive) and environmental
(common as well as random) terms (see Tenesa and Haley 2013 for a detailed
review). The proportion of genetic relative to total phenotypic variance is referred
to as H 2 , or broad-sense heritability. A typical assumption is that dominance and
interaction term nearly zero, and thus, we consider additive genetic variance relative
to total narrow-sense heritability, or h 2 . Calculating the amount of narrow-sense
heritability that genetic loci contribute is straightforward: under this additive model,
the variance is given by 2p(1-p)a 2 , where p is the allele frequency and a the
additive effect of the allele on the trait, typically in units of standard deviation.
Thus, based on a “current” set of discoveries of genetic associations, along with
estimates of heritability from twin or family studies, one can determine how much