

Cross-section view
1.5 m
Ground
surface
Plan view
1.5
m
m below ground
surface
1
2
3
5 m
Direction of
Nested wells
4
Sand backfill
Iron-reactive 5
barrier
Monitoring
6
well screen
groundwater
7
Multilevel
Legend
flow
piezometers
Multilevel piezometers
8
Direction of
Monitoring well screen
groundwater
Nested wells
flow
9
262
Permeable Reactive Barrier
Multilevel piezometers
5542
5185
1200
1200
400 400
2220
1510
1865
FIGURE 12.10
Plan view sketch of the sheet-piled excavation (nominal dimensions in millimeters). (From
Orica Ltd.)
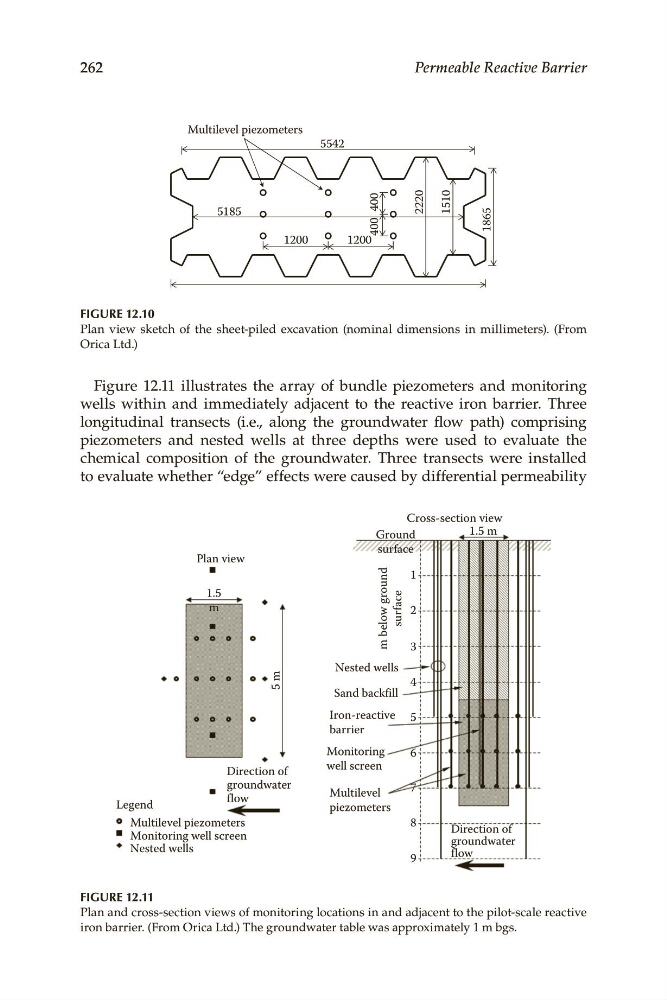
Figure 12.11 illustrates the array of bundle piezometers and monitoring
wells within and immediately adjacent to the reactive iron barrier. Three
longitudinal transects (i.e., along the groundwater flow path) comprising
piezometers and nested wells at three depths were used to evaluate the
chemical composition of the groundwater. Three transects were installed
to evaluate whether “edge” effects were caused by differential permeability
FIGURE 12.11
Plan and cross-section views of monitoring locations in and adjacent to the pilot-scale reactive
iron barrier. (From Orica Ltd.) The groundwater table was approximately 1 m bgs.
1.5 m
Ground
surface
Plan view
1.5
m
m below ground
surface
1
2
3
5 m
Direction of
Nested wells
4
Sand backfill
Iron-reactive 5
barrier
Monitoring
6
well screen
groundwater
7
Multilevel
Legend
flow
piezometers
Multilevel piezometers
8
Direction of
Monitoring well screen
groundwater
Nested wells
flow
9
262
Permeable Reactive Barrier
Multilevel piezometers
5542
5185
1200
1200
400 400
2220
1510
1865
FIGURE 12.10
Plan view sketch of the sheet-piled excavation (nominal dimensions in millimeters). (From
Orica Ltd.)
Figure 12.11 illustrates the array of bundle piezometers and monitoring
wells within and immediately adjacent to the reactive iron barrier. Three
longitudinal transects (i.e., along the groundwater flow path) comprising
piezometers and nested wells at three depths were used to evaluate the
chemical composition of the groundwater. Three transects were installed
to evaluate whether “edge” effects were caused by differential permeability
FIGURE 12.11
Plan and cross-section views of monitoring locations in and adjacent to the pilot-scale reactive
iron barrier. (From Orica Ltd.) The groundwater table was approximately 1 m bgs.