

234
Permeable Reactive Barrier
0.0
0.5
1.0
1.5
c/c
0
c
0 /mg L –1
0
5
10
15
Benzene
Toluene
Benzofuran
Eq. model benzene
Eq. model toluene
Eq. model benzofuran
0
200
400
600
800
1000 1200 1400 1600
t/h
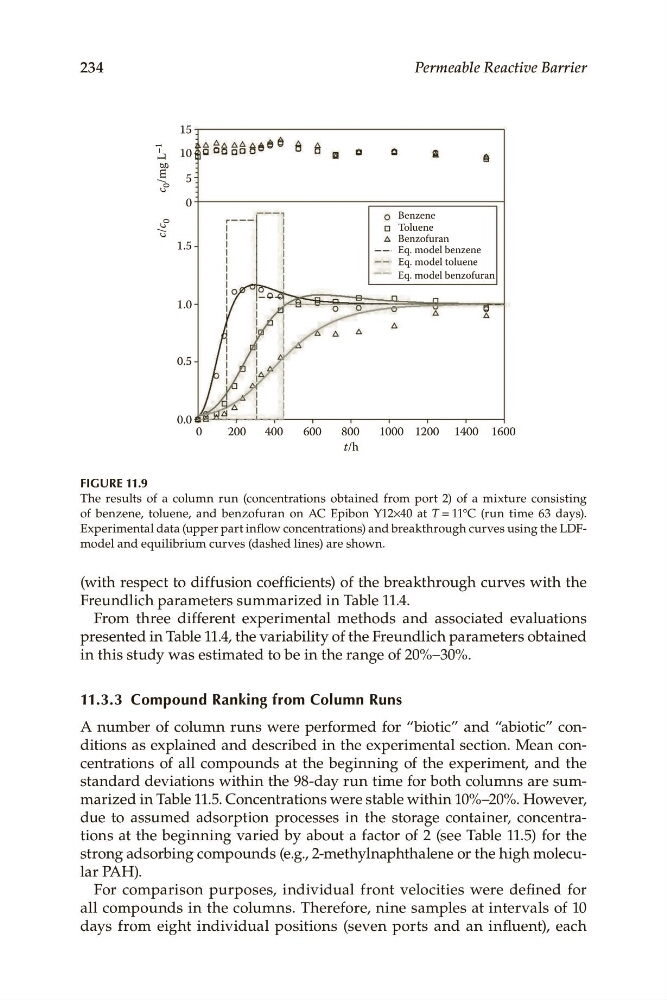
FIGURE 11.9
The results of a column run (concentrations obtained from port 2) of a mixture consisting
of benzene, toluene, and benzofuran on AC Epibon Y12×40 at T = 11°C (run time 63 days).
Experimental data (upper part inflow concentrations) and breakthrough curves using the LDFmodel and equilibrium curves (dashed lines) are shown.
(with respect to diffusion coefficients) of the breakthrough curves with the
Freundlich parameters summarized in Table 11.4.
From three different experimental methods and associated evaluations
presented in Table 11.4, the variability of the Freundlich parameters obtained
in this study was estimated to be in the range of 20%–30%.
11.3.3 Compound Ranking from Column Runs
A number of column runs were performed for “biotic” and “abiotic” conditions as explained and described in the experimental section. Mean concentrations of all compounds at the beginning of the experiment, and the
standard deviations within the 98-day run time for both columns are summarized in Table 11.5. Concentrations were stable within 10%–20%. However,
due to assumed adsorption processes in the storage container, concentrations at the beginning varied by about a factor of 2 (see Table 11.5) for the
strong adsorbing compounds (e.g., 2-methylnaphthalene or the high molecular PAH).
For comparison purposes, individual front velocities were defined for
all compounds in the columns. Therefore, nine samples at intervals of 10
days from eight individual positions (seven ports and an influent), each
Permeable Reactive Barrier
0.0
0.5
1.0
1.5
c/c
0
c
0 /mg L –1
0
5
10
15
Benzene
Toluene
Benzofuran
Eq. model benzene
Eq. model toluene
Eq. model benzofuran
0
200
400
600
800
1000 1200 1400 1600
t/h
FIGURE 11.9
The results of a column run (concentrations obtained from port 2) of a mixture consisting
of benzene, toluene, and benzofuran on AC Epibon Y12×40 at T = 11°C (run time 63 days).
Experimental data (upper part inflow concentrations) and breakthrough curves using the LDFmodel and equilibrium curves (dashed lines) are shown.
(with respect to diffusion coefficients) of the breakthrough curves with the
Freundlich parameters summarized in Table 11.4.
From three different experimental methods and associated evaluations
presented in Table 11.4, the variability of the Freundlich parameters obtained
in this study was estimated to be in the range of 20%–30%.
11.3.3 Compound Ranking from Column Runs
A number of column runs were performed for “biotic” and “abiotic” conditions as explained and described in the experimental section. Mean concentrations of all compounds at the beginning of the experiment, and the
standard deviations within the 98-day run time for both columns are summarized in Table 11.5. Concentrations were stable within 10%–20%. However,
due to assumed adsorption processes in the storage container, concentrations at the beginning varied by about a factor of 2 (see Table 11.5) for the
strong adsorbing compounds (e.g., 2-methylnaphthalene or the high molecular PAH).
For comparison purposes, individual front velocities were defined for
all compounds in the columns. Therefore, nine samples at intervals of 10
days from eight individual positions (seven ports and an influent), each