

Eh (mV)
pH
250
200
150
6
Alpha-FeOOH
7
8
Fe 3 (OH) 8
9
10
Fe(OH) 3
11
MWG104A
MWG104B
MWG104C
100
50
MWG105A
MWG105B
0
MWG105C
12
MWG103A
–50
MWG103B
MWG103C
–100
–150
–200
–250
132
Permeable Reactive Barrier
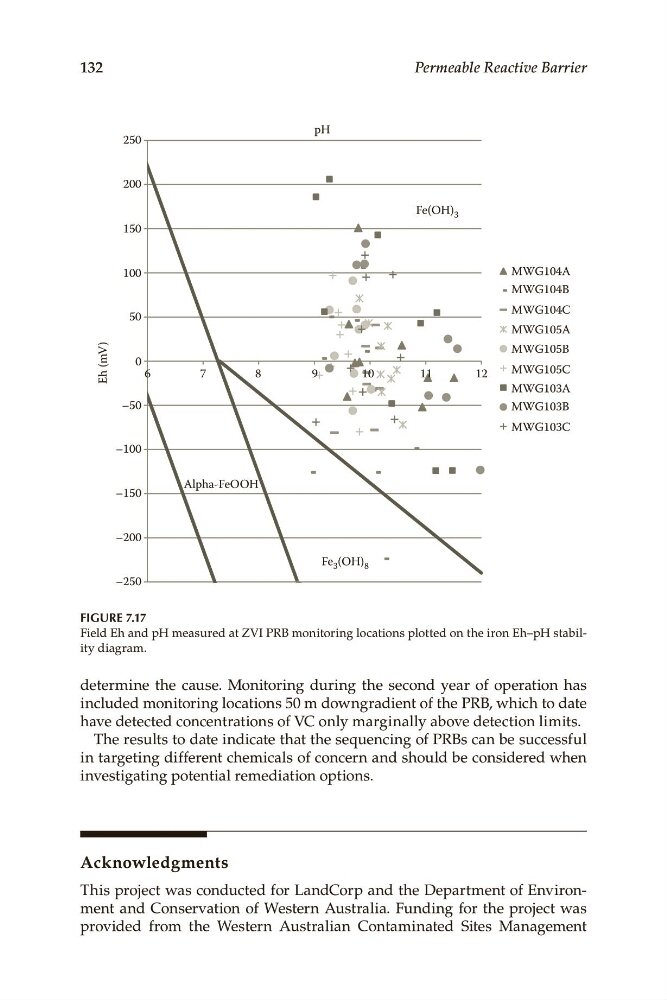
FIGURE 7.17
Field Eh and pH measured at ZVI PRB monitoring locations plotted on the iron Eh–pH stability diagram.
determine the cause. Monitoring during the second year of operation has
included monitoring locations 50 m downgradient of the PRB, which to date
have detected concentrations of VC only marginally above detection limits.
The results to date indicate that the sequencing of PRBs can be successful
in targeting different chemicals of concern and should be considered when
investigating potential remediation options.
Acknowledgments
This project was conducted for LandCorp and the Department of Environment and Conservation of Western Australia. Funding for the project was
provided from the Western Australian Contaminated Sites Management
pH
250
200
150
6
Alpha-FeOOH
7
8
Fe 3 (OH) 8
9
10
Fe(OH) 3
11
MWG104A
MWG104B
MWG104C
100
50
MWG105A
MWG105B
0
MWG105C
12
MWG103A
–50
MWG103B
MWG103C
–100
–150
–200
–250
132
Permeable Reactive Barrier
FIGURE 7.17
Field Eh and pH measured at ZVI PRB monitoring locations plotted on the iron Eh–pH stability diagram.
determine the cause. Monitoring during the second year of operation has
included monitoring locations 50 m downgradient of the PRB, which to date
have detected concentrations of VC only marginally above detection limits.
The results to date indicate that the sequencing of PRBs can be successful
in targeting different chemicals of concern and should be considered when
investigating potential remediation options.
Acknowledgments
This project was conducted for LandCorp and the Department of Environment and Conservation of Western Australia. Funding for the project was
provided from the Western Australian Contaminated Sites Management