

1 0
µ g / L
330 µg /L
MWG87
MWG73
MWG74
MWG88
MWG75
MWG76
MWG89
MWG79
MWG78
MWG90
7.5
1400
<1
<1
450
61
36
Elevation (mAHD)
–2.5
–5.0
A
A'
Southwest
Northeast
Wellscreen TCE
concentration
5
0
5 10 meters
(µg/L)
5.0
2000
<1
5
1100
1300
10
2.5
<1
9
750
2
Transition zone
100 µg/L
<1
0.0 12
5
41
40
Inferred clay
Leederville formation
<1
Sequenced PRB for the Pretreatment of Nitrate and Remediation of TCE
117
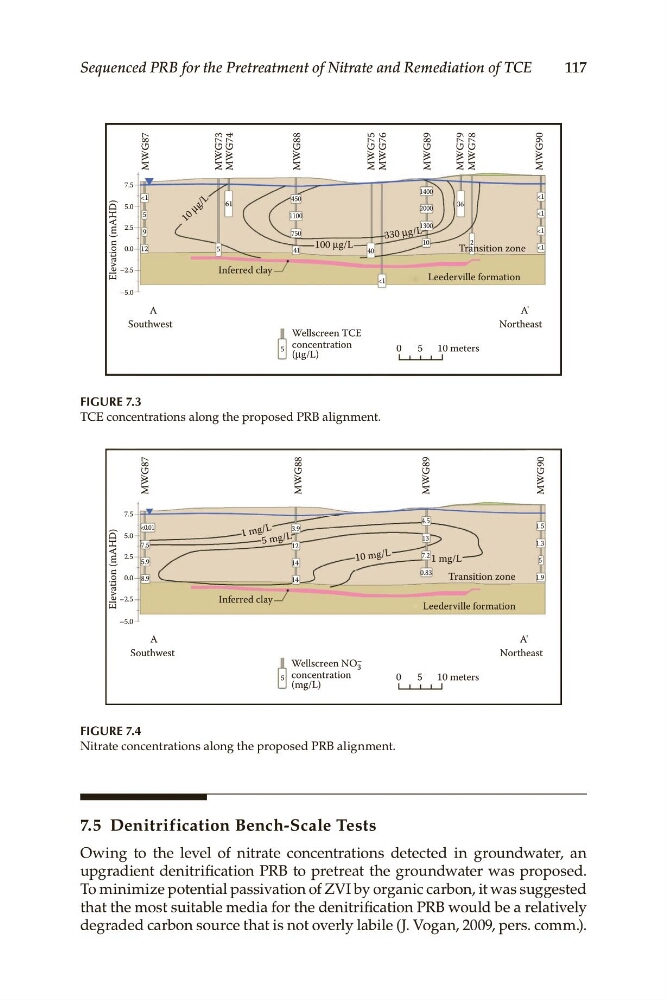
FIGURE 7.3
TCE concentrations along the proposed PRB alignment.
MWG87
10 mg /L
MWG88
1 m g/ L
5 mg /L
(mg/L)
Leederville formation
Transition zone
1 mg/L
Inferred clay
Southwest
Wellscreen NO 3
–
concentration
A
5
7.5
5.9
3.9
4.5
1.5
1.3
1.9
5
13
7.2
0.83
12
14
14
8.9
<0.01
7.5
5.0
2.5
0.0
–2.5
–5.0
Northeast
0
5 10 meters
A'
Elevation (mAHD)
MWG89
MWG90
FIGURE 7.4
Nitrate concentrations along the proposed PRB alignment.
7.5 Denitrification Bench-Scale Tests
Owing to the level of nitrate concentrations detected in groundwater, an
upgradient denitrification PRB to pretreat the groundwater was proposed.
To minimize potential passivation of ZVI by organic carbon, it was suggested
that the most suitable media for the denitrification PRB would be a relatively
degraded carbon source that is not overly labile (J. Vogan, 2009, pers. comm.).
µ g / L
330 µg /L
MWG87
MWG73
MWG74
MWG88
MWG75
MWG76
MWG89
MWG79
MWG78
MWG90
7.5
1400
<1
<1
450
61
36
Elevation (mAHD)
–2.5
–5.0
A
A'
Southwest
Northeast
Wellscreen TCE
concentration
5
0
5 10 meters
(µg/L)
5.0
2000
<1
5
1100
1300
10
2.5
<1
9
750
2
Transition zone
100 µg/L
<1
0.0 12
5
41
40
Inferred clay
Leederville formation
<1
Sequenced PRB for the Pretreatment of Nitrate and Remediation of TCE
117
FIGURE 7.3
TCE concentrations along the proposed PRB alignment.
MWG87
10 mg /L
MWG88
1 m g/ L
5 mg /L
(mg/L)
Leederville formation
Transition zone
1 mg/L
Inferred clay
Southwest
Wellscreen NO 3
–
concentration
A
5
7.5
5.9
3.9
4.5
1.5
1.3
1.9
5
13
7.2
0.83
12
14
14
8.9
<0.01
7.5
5.0
2.5
0.0
–2.5
–5.0
Northeast
0
5 10 meters
A'
Elevation (mAHD)
MWG89
MWG90
FIGURE 7.4
Nitrate concentrations along the proposed PRB alignment.
7.5 Denitrification Bench-Scale Tests
Owing to the level of nitrate concentrations detected in groundwater, an
upgradient denitrification PRB to pretreat the groundwater was proposed.
To minimize potential passivation of ZVI by organic carbon, it was suggested
that the most suitable media for the denitrification PRB would be a relatively
degraded carbon source that is not overly labile (J. Vogan, 2009, pers. comm.).