

104
Permeable Reactive Barrier
100
5 ppb
50 ppb
100
80
80
Cumulative %
Cumulative %
60
60
40
40
20
20
0
0
–1
0
1
2
3
4
–1
0
1
2
3
4
log Cr (ppb)
log TCE (ppb)
100
5 ppb
100
80
80
60
60
40
40
20
20
50 ppb
0
0
1
log VC (ppb)
2
3
0
0
1
2
log cis-DCE (ppb)
3
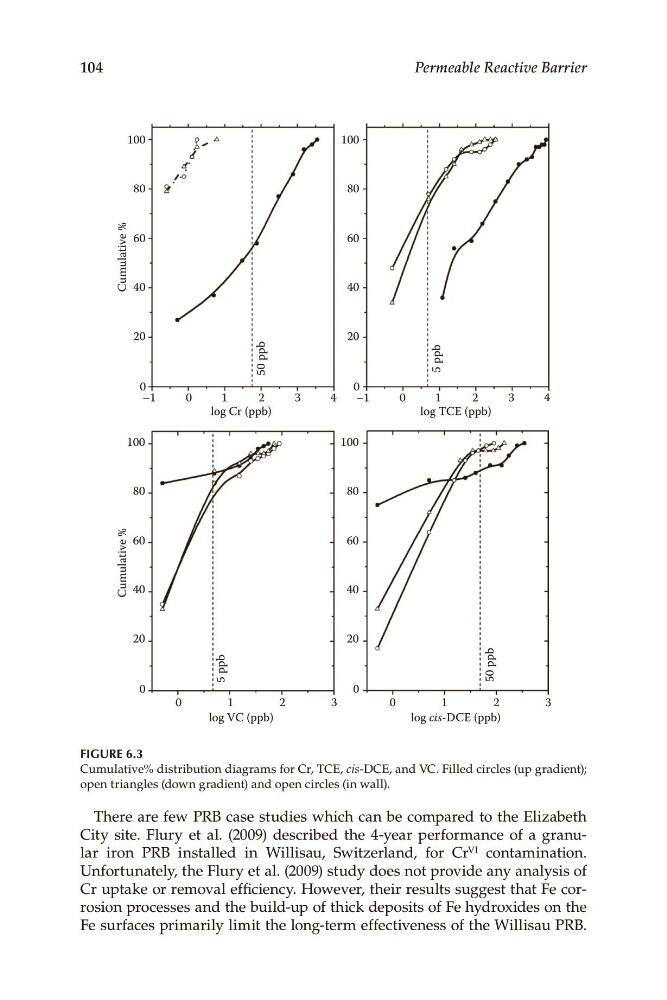
FIGURE 6.3
Cumulative% distribution diagrams for Cr, TCE, cis-DCE, and VC. Filled circles (up gradient);
open triangles (down gradient) and open circles (in wall).
There are few PRB case studies which can be compared to the Elizabeth
City site. Flury et al. (2009) described the 4-year performance of a granular iron PRB installed in Willisau, Switzerland, for Cr VI contamination.
Unfortunately, the Flury et al. (2009) study does not provide any analysis of
Cr uptake or removal efficiency. However, their results suggest that Fe corrosion processes and the build-up of thick deposits of Fe hydroxides on the
Fe surfaces primarily limit the long-term effectiveness of the Willisau PRB.
Permeable Reactive Barrier
100
5 ppb
50 ppb
100
80
80
Cumulative %
Cumulative %
60
60
40
40
20
20
0
0
–1
0
1
2
3
4
–1
0
1
2
3
4
log Cr (ppb)
log TCE (ppb)
100
5 ppb
100
80
80
60
60
40
40
20
20
50 ppb
0
0
1
log VC (ppb)
2
3
0
0
1
2
log cis-DCE (ppb)
3
FIGURE 6.3
Cumulative% distribution diagrams for Cr, TCE, cis-DCE, and VC. Filled circles (up gradient);
open triangles (down gradient) and open circles (in wall).
There are few PRB case studies which can be compared to the Elizabeth
City site. Flury et al. (2009) described the 4-year performance of a granular iron PRB installed in Willisau, Switzerland, for Cr VI contamination.
Unfortunately, the Flury et al. (2009) study does not provide any analysis of
Cr uptake or removal efficiency. However, their results suggest that Fe corrosion processes and the build-up of thick deposits of Fe hydroxides on the
Fe surfaces primarily limit the long-term effectiveness of the Willisau PRB.