

0 .0 5 m g / L
1 mg/L
0
.0
5
m
g
/
L
Pasquotank River
MW46
MW35D
N
MW47
ML35
ML34
ML33
ML25
ML24
ML23
MW50
ML15
MW49
ML14
ML22
ML13
ML32
ML21
ML12
Fe 0
ML31
MW48
ML11
Building 78
MW38
PRB
1 mg/L
MW18
MW compliance well
(5–10 ft. screen)
ML multilevel bundle
(6 in. screens)
0
10 m
MW13
Approx. scale
Plating
Groundwater
shop
flow direction
Hangar 79
101
Fourteen-Year Assessment of a PRB
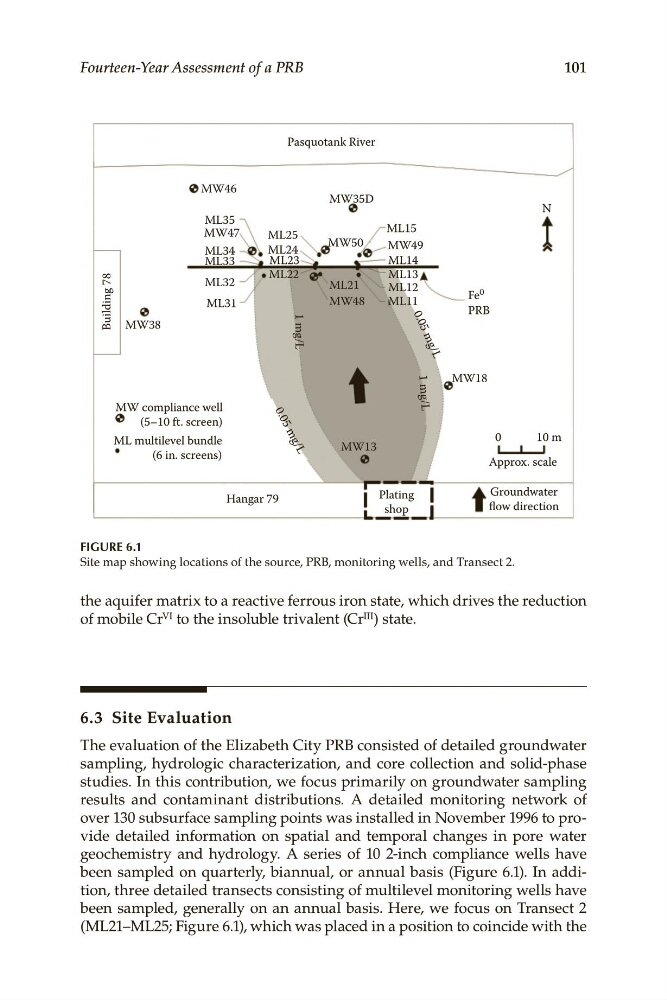
FIGURE 6.1
Site map showing locations of the source, PRB, monitoring wells, and Transect 2.
the aquifer matrix to a reactive ferrous iron state, which drives the reduction
of mobile Cr VI to the insoluble trivalent (Cr III ) state.
6.3 Site Evaluation
The evaluation of the Elizabeth City PRB consisted of detailed groundwater
sampling, hydrologic characterization, and core collection and solid-phase
studies. In this contribution, we focus primarily on groundwater sampling
results and contaminant distributions. A detailed monitoring network of
over 130 subsurface sampling points was installed in November 1996 to provide detailed information on spatial and temporal changes in pore water
geochemistry and hydrology. A series of 10 2-inch compliance wells have
been sampled on quarterly, biannual, or annual basis (Figure 6.1). In addition, three detailed transects consisting of multilevel monitoring wells have
been sampled, generally on an annual basis. Here, we focus on Transect 2
(ML21–ML25; Figure 6.1), which was placed in a position to coincide with the
1 mg/L
0
.0
5
m
g
/
L
Pasquotank River
MW46
MW35D
N
MW47
ML35
ML34
ML33
ML25
ML24
ML23
MW50
ML15
MW49
ML14
ML22
ML13
ML32
ML21
ML12
Fe 0
ML31
MW48
ML11
Building 78
MW38
PRB
1 mg/L
MW18
MW compliance well
(5–10 ft. screen)
ML multilevel bundle
(6 in. screens)
0
10 m
MW13
Approx. scale
Plating
Groundwater
shop
flow direction
Hangar 79
101
Fourteen-Year Assessment of a PRB
FIGURE 6.1
Site map showing locations of the source, PRB, monitoring wells, and Transect 2.
the aquifer matrix to a reactive ferrous iron state, which drives the reduction
of mobile Cr VI to the insoluble trivalent (Cr III ) state.
6.3 Site Evaluation
The evaluation of the Elizabeth City PRB consisted of detailed groundwater
sampling, hydrologic characterization, and core collection and solid-phase
studies. In this contribution, we focus primarily on groundwater sampling
results and contaminant distributions. A detailed monitoring network of
over 130 subsurface sampling points was installed in November 1996 to provide detailed information on spatial and temporal changes in pore water
geochemistry and hydrology. A series of 10 2-inch compliance wells have
been sampled on quarterly, biannual, or annual basis (Figure 6.1). In addition, three detailed transects consisting of multilevel monitoring wells have
been sampled, generally on an annual basis. Here, we focus on Transect 2
(ML21–ML25; Figure 6.1), which was placed in a position to coincide with the