

Actors and innovators in the bioeconomy 215
The population frame of the survey includes all departments in the higher
education sector (84) and the research institute sector (47) who report R&D
expenditures in this area and/or publish in this area. A further 462 private sector
actors were included. This population represents a full count of firms that receive
research, development and innovation (RD&I) grants from the Research
Council of Norway in relevant fields. Over 80% of the entities canvassed replied.
Information from 230 research active entities is used in the analysis.
The basis of our analysis is thus all entities who receive public money to
finance research, development and innovation activities in the area of agriculture and food. This represents a quasi- totality of research activity, and the
selected lens provides a census for this important part of the bioeconomy.
The university (HEI) and the research institute (RI) sectors are known to be
key in this research area. R&D resource allocation, including expenditures, is
reported by the institutions themselves, based on a breakdown of in- house
activities. The departments in the higher education sector (HES) and research
institutes reported a percentage of their R&D activity which was defined as
agricultural and food- related R&D. Firms in the industrial sector reported on
actual amount spent on R&D in that particular research field. The questionnaire then asked all respondents to break down the agricultural R&D into
thematic sub- fields which included circular bioeconomy. The numbers on
R&D in circular bioeconomy are therefore estimates made by the R&D performers themselves.
Agriculture and food R&D totalled NOK 2.4 billion and has grown at an
annual rate of about 2.4% in real terms between 2007 and 2015. A total of
2,900 researchers were reported to be involved in R&D activity in this area
in 2015 (Rørstad & Sundnes, 2017). It should be noted that this approach
does not include the important activities of ocean fisheries and aquaculture.
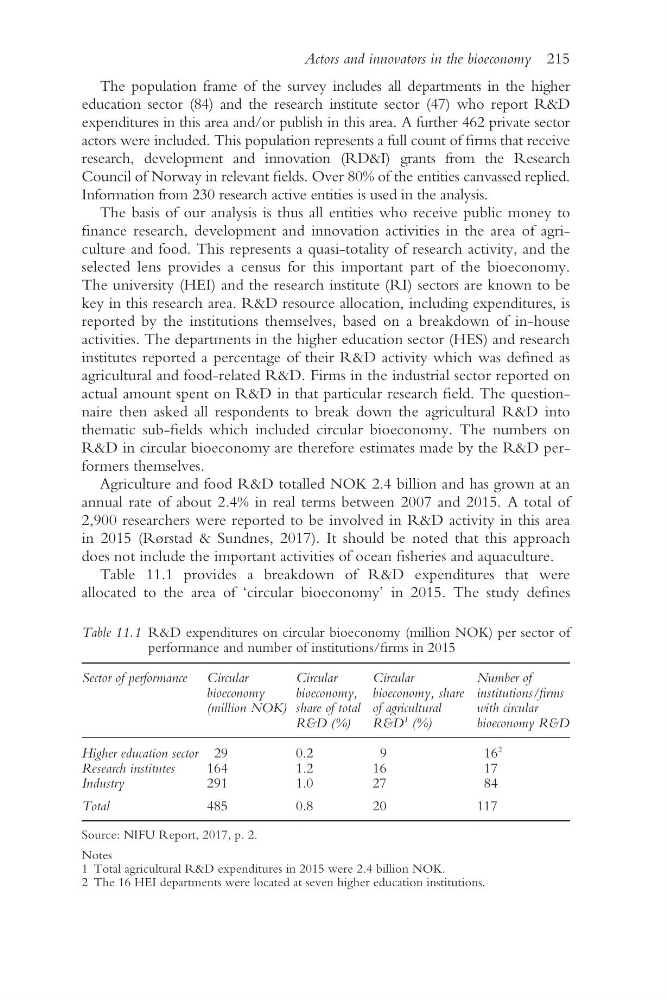
Table 11.1 provides a breakdown of R&D expenditures that were
allocated to the area of ‘circular bioeconomy’ in 2015. The study defines
Table 11.1 R&D expenditures on circular bioeconomy (million NOK) per sector of
performance and number of institutions/firms in 2015
Sector of performance Circular
bioeconomy
(million NOK)
Circular
bioeconomy,
share of total
R&D (%)
Circular
bioeconomy, share
of agricultural
R&D
1
(%)
Number of
institutions/firms
with circular
bioeconomy R&D
Higher education sector 29
0.2
9
16
2
Research institutes
164
1.2
16
17
Industry
291
1.0
27
84
Total
485
0.8
20
117
Source: NIFU Report, 2017, p. 2.
Notes
1 Total agricultural R&D expenditures in 2015 were 2.4 billion NOK.
2 The 16 HEI departments were located at seven higher education institutions.
The population frame of the survey includes all departments in the higher
education sector (84) and the research institute sector (47) who report R&D
expenditures in this area and/or publish in this area. A further 462 private sector
actors were included. This population represents a full count of firms that receive
research, development and innovation (RD&I) grants from the Research
Council of Norway in relevant fields. Over 80% of the entities canvassed replied.
Information from 230 research active entities is used in the analysis.
The basis of our analysis is thus all entities who receive public money to
finance research, development and innovation activities in the area of agriculture and food. This represents a quasi- totality of research activity, and the
selected lens provides a census for this important part of the bioeconomy.
The university (HEI) and the research institute (RI) sectors are known to be
key in this research area. R&D resource allocation, including expenditures, is
reported by the institutions themselves, based on a breakdown of in- house
activities. The departments in the higher education sector (HES) and research
institutes reported a percentage of their R&D activity which was defined as
agricultural and food- related R&D. Firms in the industrial sector reported on
actual amount spent on R&D in that particular research field. The questionnaire then asked all respondents to break down the agricultural R&D into
thematic sub- fields which included circular bioeconomy. The numbers on
R&D in circular bioeconomy are therefore estimates made by the R&D performers themselves.
Agriculture and food R&D totalled NOK 2.4 billion and has grown at an
annual rate of about 2.4% in real terms between 2007 and 2015. A total of
2,900 researchers were reported to be involved in R&D activity in this area
in 2015 (Rørstad & Sundnes, 2017). It should be noted that this approach
does not include the important activities of ocean fisheries and aquaculture.
Table 11.1 provides a breakdown of R&D expenditures that were
allocated to the area of ‘circular bioeconomy’ in 2015. The study defines
Table 11.1 R&D expenditures on circular bioeconomy (million NOK) per sector of
performance and number of institutions/firms in 2015
Sector of performance Circular
bioeconomy
(million NOK)
Circular
bioeconomy,
share of total
R&D (%)
Circular
bioeconomy, share
of agricultural
R&D
1
(%)
Number of
institutions/firms
with circular
bioeconomy R&D
Higher education sector 29
0.2
9
16
2
Research institutes
164
1.2
16
17
Industry
291
1.0
27
84
Total
485
0.8
20
117
Source: NIFU Report, 2017, p. 2.
Notes
1 Total agricultural R&D expenditures in 2015 were 2.4 billion NOK.
2 The 16 HEI departments were located at seven higher education institutions.