

The knowledge base of the bioeconomy 199
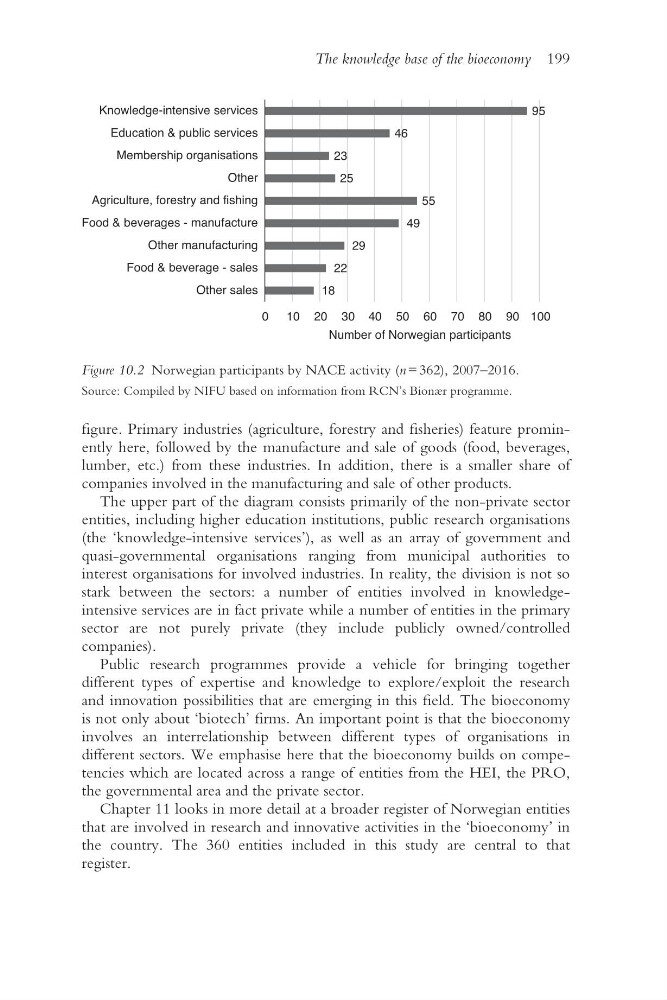
figure. Primary industries (agriculture, forestry and fisheries) feature prominently here, followed by the manufacture and sale of goods (food, beverages,
lumber, etc.) from these industries. In addition, there is a smaller share of
companies involved in the manufacturing and sale of other products.
The upper part of the diagram consists primarily of the non- private sector
entities, including higher education institutions, public research organisations
(the ‘knowledge- intensive services’), as well as an array of government and
quasi- governmental organisations ranging from municipal authorities to
interest organisations for involved industries. In reality, the division is not so
stark between the sectors: a number of entities involved in knowledgeintensive services are in fact private while a number of entities in the primary
sector are not purely private (they include publicly owned/controlled
companies).
Public research programmes provide a vehicle for bringing together
different types of expertise and knowledge to explore/exploit the research
and innovation possibilities that are emerging in this field. The bioeconomy
is not only about ‘biotech’ firms. An important point is that the bioeconomy
involves an interrelationship between different types of organisations in
different sectors. We emphasise here that the bioeconomy builds on competencies which are located across a range of entities from the HEI, the PRO,
the governmental area and the private sector.
Chapter 11 looks in more detail at a broader register of Norwegian entities
that are involved in research and innovative activities in the ‘bioeconomy’ in
the country. The 360 entities included in this study are central to that
register.
18
22
29
49
55
25
23
46
95
0 10 20 30 40 50 60 70 80 90 100
Other sales
Food & beverage - sales
Other manufacturing
Food & beverages - manufacture
Agriculture, forestry and fishing
Other
Membership organisations
Education & public services
Knowledge-intensive services
Number of Norwegian participants
Figure 10.2 Norwegian participants by NACE activity (n = 362), 2007–2016.
Source: Compiled by NIFU based on information from RCN’s Bionær programme.
figure. Primary industries (agriculture, forestry and fisheries) feature prominently here, followed by the manufacture and sale of goods (food, beverages,
lumber, etc.) from these industries. In addition, there is a smaller share of
companies involved in the manufacturing and sale of other products.
The upper part of the diagram consists primarily of the non- private sector
entities, including higher education institutions, public research organisations
(the ‘knowledge- intensive services’), as well as an array of government and
quasi- governmental organisations ranging from municipal authorities to
interest organisations for involved industries. In reality, the division is not so
stark between the sectors: a number of entities involved in knowledgeintensive services are in fact private while a number of entities in the primary
sector are not purely private (they include publicly owned/controlled
companies).
Public research programmes provide a vehicle for bringing together
different types of expertise and knowledge to explore/exploit the research
and innovation possibilities that are emerging in this field. The bioeconomy
is not only about ‘biotech’ firms. An important point is that the bioeconomy
involves an interrelationship between different types of organisations in
different sectors. We emphasise here that the bioeconomy builds on competencies which are located across a range of entities from the HEI, the PRO,
the governmental area and the private sector.
Chapter 11 looks in more detail at a broader register of Norwegian entities
that are involved in research and innovative activities in the ‘bioeconomy’ in
the country. The 360 entities included in this study are central to that
register.
18
22
29
49
55
25
23
46
95
0 10 20 30 40 50 60 70 80 90 100
Other sales
Food & beverage - sales
Other manufacturing
Food & beverages - manufacture
Agriculture, forestry and fishing
Other
Membership organisations
Education & public services
Knowledge-intensive services
Number of Norwegian participants
Figure 10.2 Norwegian participants by NACE activity (n = 362), 2007–2016.
Source: Compiled by NIFU based on information from RCN’s Bionær programme.