

100 M. M. Bugge and A. M. Fevolden
fine- sorting of waste streams. In 2010, the first pilot including the establishment of new value chains based on the sorted waste streams was initiated.
Then, after the sorting routines were well established, this was implemented
by all ASKO enterprises from 2011 to 2012, and ASKO took over the
logistics and transport of the sorted waste resources.
Commodity markets exist for the interim products: e.g. a secondary raw
material market for items such as cardboard, plastics and metals. ASKO is able
to earn revenue from these types of waste, but for food waste generating a
profit is more challenging. Currently, ASKO is working to separate two types
of food waste, with different objectives: bread, fruit and vegetables for feed
production, and other food waste – mixed food waste and animal food waste
– for biogas production. This can be done because food waste from private
businesses is not mixed in the same way as food waste from households; e.g.,
bread that is not sold can be used as a resource for feed production. The
biogas component is used in a large number of local biogas facilities. There is
a conflict between the use of waste resources for energy on the one hand and
for recycling, including feed production, on the other. ASKO has decided to
prioritise environmental investments over economic investments and believes
that this can also be legitimised economically by taking a more long- term
perspective.
Besides large actors such as the municipal administration and private companies like ASKO, there are several smaller niche projects which are attempting to exploit organic waste for new purposes, such as utilising coffee gravel
from coffee shops in the production of mushrooms or soap or establishing
low- price lunch restaurants which serve food that would otherwise have been
thrown away. This lack of coordination across parallel public and private subsectors in the processing and treatment of organic waste in Oslo shows the
fragmented infrastructure of waste processing, and potentially limits critical
mass and synergies across sectors and waste streams.
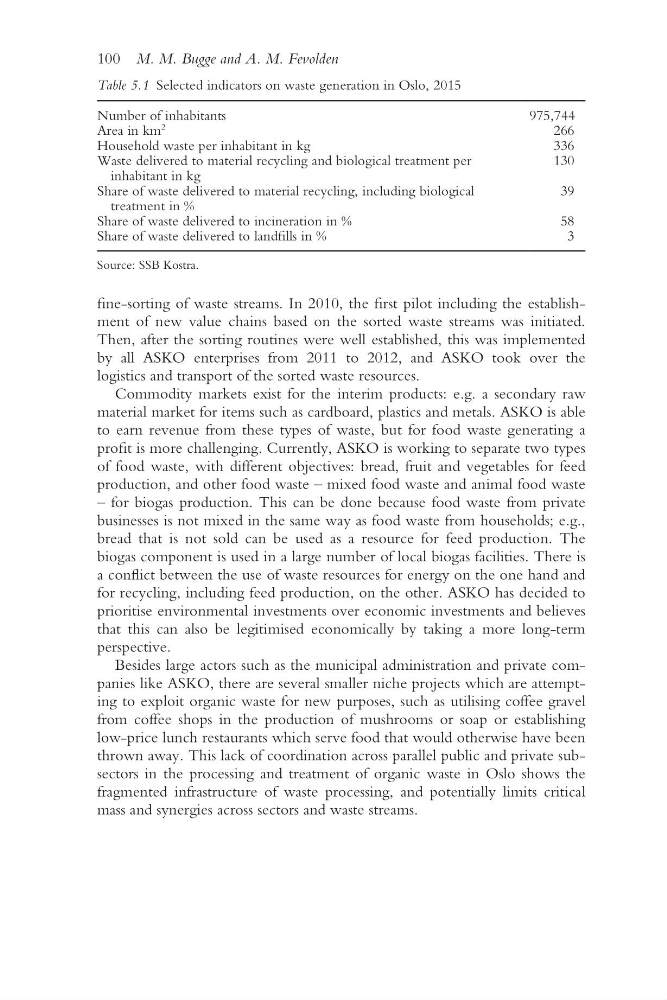
Table 5.1 Selected indicators on waste generation in Oslo, 2015
Number of inhabitants
975,744
Area in km
2
266
Household waste per inhabitant in kg
336
Waste delivered to material recycling and biological treatment per
inhabitant in kg
130
Share of waste delivered to material recycling, including biological
treatment in %
39
Share of waste delivered to incineration in %
58
Share of waste delivered to landfills in %
3
Source: SSB Kostra.
fine- sorting of waste streams. In 2010, the first pilot including the establishment of new value chains based on the sorted waste streams was initiated.
Then, after the sorting routines were well established, this was implemented
by all ASKO enterprises from 2011 to 2012, and ASKO took over the
logistics and transport of the sorted waste resources.
Commodity markets exist for the interim products: e.g. a secondary raw
material market for items such as cardboard, plastics and metals. ASKO is able
to earn revenue from these types of waste, but for food waste generating a
profit is more challenging. Currently, ASKO is working to separate two types
of food waste, with different objectives: bread, fruit and vegetables for feed
production, and other food waste – mixed food waste and animal food waste
– for biogas production. This can be done because food waste from private
businesses is not mixed in the same way as food waste from households; e.g.,
bread that is not sold can be used as a resource for feed production. The
biogas component is used in a large number of local biogas facilities. There is
a conflict between the use of waste resources for energy on the one hand and
for recycling, including feed production, on the other. ASKO has decided to
prioritise environmental investments over economic investments and believes
that this can also be legitimised economically by taking a more long- term
perspective.
Besides large actors such as the municipal administration and private companies like ASKO, there are several smaller niche projects which are attempting to exploit organic waste for new purposes, such as utilising coffee gravel
from coffee shops in the production of mushrooms or soap or establishing
low- price lunch restaurants which serve food that would otherwise have been
thrown away. This lack of coordination across parallel public and private subsectors in the processing and treatment of organic waste in Oslo shows the
fragmented infrastructure of waste processing, and potentially limits critical
mass and synergies across sectors and waste streams.
Table 5.1 Selected indicators on waste generation in Oslo, 2015
Number of inhabitants
975,744
Area in km
2
266
Household waste per inhabitant in kg
336
Waste delivered to material recycling and biological treatment per
inhabitant in kg
130
Share of waste delivered to material recycling, including biological
treatment in %
39
Share of waste delivered to incineration in %
58
Share of waste delivered to landfills in %
3
Source: SSB Kostra.