

66 Ground improvement by deep vibratory methods
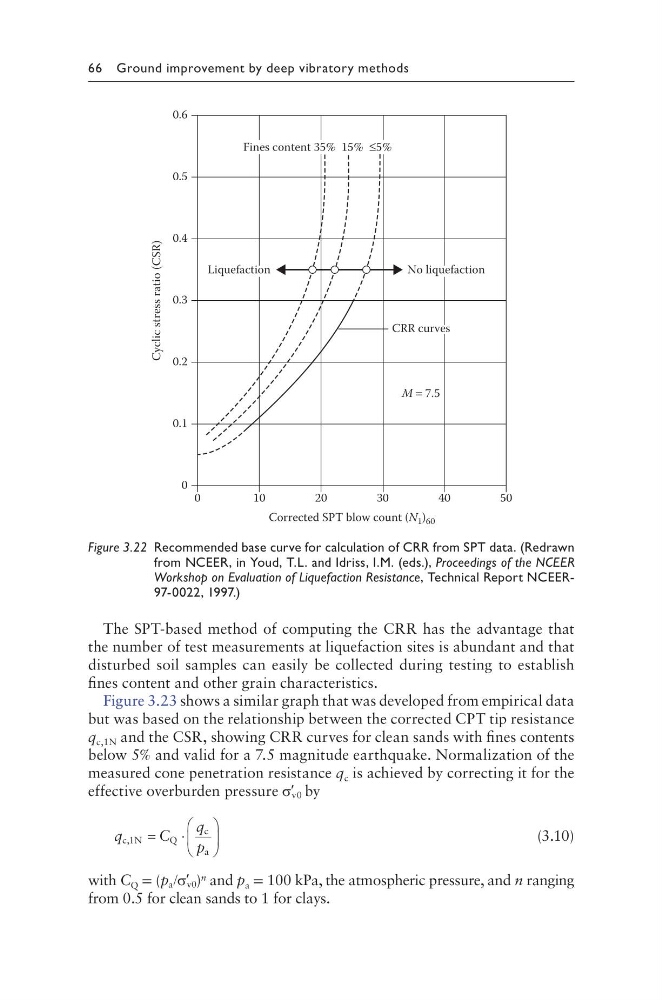
The SPT-based method of computing the CRR has the advantage that
the number of test measurements at liquefaction sites is abundant and that
disturbed soil samples can easily be collected during testing to establish
fines content and other grain characteristics.
Figure 3.23 shows a similar graph that was developed from empirical data
but was based on the relationship between the corrected CPT tip resistance
q c,1N and the CSR, showing CRR curves for clean sands with fines contents
below 5% and valid for a 7.5 magnitude earthquake. Normalization of the
measured cone penetration resistance q c is achieved by correcting it for the
effective overburden pressure ′
σ v0 by
q
C
q
p
c 1N
Q
c
a
,
=
⋅
(3.10)
with C Q = (p a v0
/ ′
σ ) n and p a = 100 kPa, the atmospheric pressure, and n ranging
from 0.5 for clean sands to 1 for clays.
20
30
40
50
10
0
0.3
0.2
0.1
0.5
0.4
0.6
0
Corrected SPT blow count (N 1 ) 60
No liquefaction
Liquefaction
M = 7.5
CRR curves
Fines content 35% 15% ≤5%
Cyclic stress ratio (CSR)
Figure 3.22 Recommended base curve for calculation of CRR from SPT data. (Redrawn
from NCEER, in Youd, T.L. and Idriss, I.M. (eds.), Proceedings of the NCEER
Workshop on Evaluation of Liquefaction Resistance, Technical Report NCEER97-0022, 1997.)
The SPT-based method of computing the CRR has the advantage that
the number of test measurements at liquefaction sites is abundant and that
disturbed soil samples can easily be collected during testing to establish
fines content and other grain characteristics.
Figure 3.23 shows a similar graph that was developed from empirical data
but was based on the relationship between the corrected CPT tip resistance
q c,1N and the CSR, showing CRR curves for clean sands with fines contents
below 5% and valid for a 7.5 magnitude earthquake. Normalization of the
measured cone penetration resistance q c is achieved by correcting it for the
effective overburden pressure ′
σ v0 by
q
C
q
p
c 1N
Q
c
a
,
=
⋅
(3.10)
with C Q = (p a v0
/ ′
σ ) n and p a = 100 kPa, the atmospheric pressure, and n ranging
from 0.5 for clean sands to 1 for clays.
20
30
40
50
10
0
0.3
0.2
0.1
0.5
0.4
0.6
0
Corrected SPT blow count (N 1 ) 60
No liquefaction
Liquefaction
M = 7.5
CRR curves
Fines content 35% 15% ≤5%
Cyclic stress ratio (CSR)
Figure 3.22 Recommended base curve for calculation of CRR from SPT data. (Redrawn
from NCEER, in Youd, T.L. and Idriss, I.M. (eds.), Proceedings of the NCEER
Workshop on Evaluation of Liquefaction Resistance, Technical Report NCEER97-0022, 1997.)