

104 Ground improvement by deep vibratory methods
sand volume to be compared for acceptance with the specified target curves.
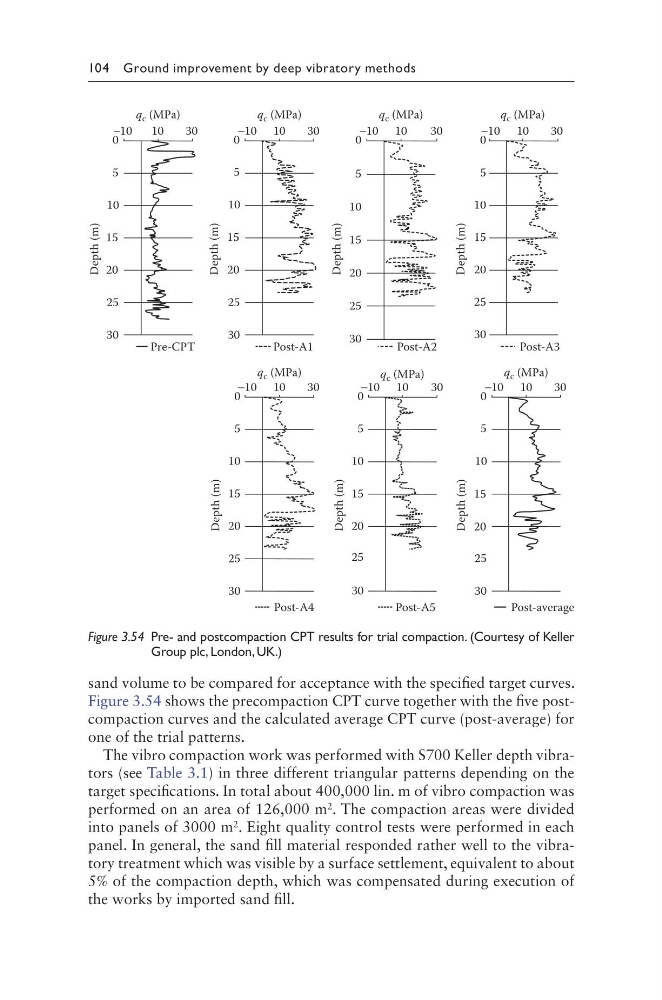
Figure 3.54 shows the precompaction CPT curve together with the five postcompaction curves and the calculated average CPT curve (post-average) for
one of the trial patterns.
The vibro compaction work was performed with S700 Keller depth vibrators (see Table 3.1) in three different triangular patterns depending on the
target specifications. In total about 400,000 lin. m of vibro compaction was
performed on an area of 126,000 m 2 . The compaction areas were divided
into panels of 3000 m 2 . Eight quality control tests were performed in each
panel. In general, the sand fill material responded rather well to the vibratory treatment which was visible by a surface settlement, equivalent to about
5% of the compaction depth, which was compensated during execution of
the works by imported sand fill.
−10
0
10
q c (MPa)
q c (MPa)
q c (MPa)
q c (MPa)
30
10
30
10
30
10
30
5
10
15
Depth (m)
Depth (m)
20
25
30
Pre-CPT
Post-A1
P ost-A2
Post-A3
Post-A4
P ost-A5
Post-average
−10
0
5
10
15
20
25
30
q c (MPa)
10
30
Depth (m)
−10
0
5
10
15
20
25
30
q c (MPa)
10
30
Depth (m)
−10
0
5
10
15
20
25
30
q c (MPa)
10
30
Depth (m)
−10
0
5
10
15
20
25
30
Depth (m)
−10
0
5
10
15
20
25
30
Depth (m)
−10
0
5
10
15
20
25
30
Figure 3.54 Pre- and postcompaction CPT results for trial compaction. (Courtesy of Keller
Group plc, London, UK.)
sand volume to be compared for acceptance with the specified target curves.
Figure 3.54 shows the precompaction CPT curve together with the five postcompaction curves and the calculated average CPT curve (post-average) for
one of the trial patterns.
The vibro compaction work was performed with S700 Keller depth vibrators (see Table 3.1) in three different triangular patterns depending on the
target specifications. In total about 400,000 lin. m of vibro compaction was
performed on an area of 126,000 m 2 . The compaction areas were divided
into panels of 3000 m 2 . Eight quality control tests were performed in each
panel. In general, the sand fill material responded rather well to the vibratory treatment which was visible by a surface settlement, equivalent to about
5% of the compaction depth, which was compensated during execution of
the works by imported sand fill.
−10
0
10
q c (MPa)
q c (MPa)
q c (MPa)
q c (MPa)
30
10
30
10
30
10
30
5
10
15
Depth (m)
Depth (m)
20
25
30
Pre-CPT
Post-A1
P ost-A2
Post-A3
Post-A4
P ost-A5
Post-average
−10
0
5
10
15
20
25
30
q c (MPa)
10
30
Depth (m)
−10
0
5
10
15
20
25
30
q c (MPa)
10
30
Depth (m)
−10
0
5
10
15
20
25
30
q c (MPa)
10
30
Depth (m)
−10
0
5
10
15
20
25
30
Depth (m)
−10
0
5
10
15
20
25
30
Depth (m)
−10
0
5
10
15
20
25
30
Figure 3.54 Pre- and postcompaction CPT results for trial compaction. (Courtesy of Keller
Group plc, London, UK.)