

349
polymorphic AFLP (amplified fragment length polymorphism) markers. Highpriority areas for conservation and domestication purposes, both from protected
areas and private fields, were identified (Inza et al. 2012).
13.2.1.1 Genetic Diversity and Differentiation
The average value of genetic diversity of C. angustifolia in Argentina is low
(Ht = 0.135, He = 0.087; GenAlEx6, Peakall and Smouse 2006), which is consistent
with the fact of being the southernmost edge of its continental range (Table 13.1,
Fig. 13.1). Additionally, C. angustifolia populations are isolated, with low density
of individuals per population and different levels of disturbance, all features of species with low levels of genetic diversity (Hamrick et al. 1992; Young and Boyle 2000).
Several indices, such as mean expected heterozygosity (He), percentage of polymorphic loci (PPL), and the number of exclusive bands (EB), were used to assess
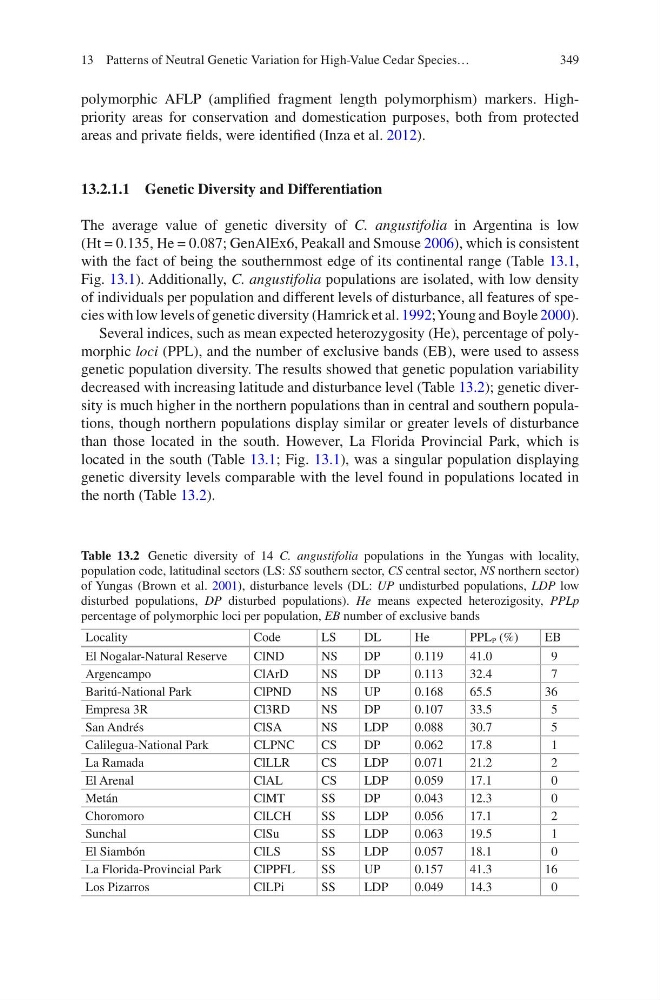
genetic population diversity. The results showed that genetic population variability
decreased with increasing latitude and disturbance level (Table 13.2); genetic diversity is much higher in the northern populations than in central and southern populations, though northern populations display similar or greater levels of disturbance
than those located in the south. However, La Florida Provincial Park, which is
located in the south (Table 13.1; Fig. 13.1), was a singular population displaying
genetic diversity levels comparable with the level found in populations located in
the north (Table 13.2).
Table 13.2 Genetic diversity of 14 C. angustifolia populations in the Yungas with locality,
population code, latitudinal sectors (LS: SS southern sector, CS central sector, NS northern sector)
of Yungas (Brown et al. 2001), disturbance levels (DL: UP undisturbed populations, LDP low
disturbed populations, DP disturbed populations). He means expected heterozigosity, PPLp
percentage of polymorphic loci per population, EB number of exclusive bands
Locality
Code
LS
DL
He
PPL P (%)
EB
El Nogalar-Natural Reserve
ClND
NS
DP
0.119
41.0
9
Argencampo
ClArD
NS
DP
0.113
32.4
7
Baritú-National Park
ClPND
NS
UP
0.168
65.5
36
Empresa 3R
Cl3RD
NS
DP
0.107
33.5
5
San Andrés
ClSA
NS
LDP
0.088
30.7
5
Calilegua-National Park
CLPNC
CS
DP
0.062
17.8
1
La Ramada
ClLLR
CS
LDP
0.071
21.2
2
El Arenal
ClAL
CS
LDP
0.059
17.1
0
Metán
ClMT
SS
DP
0.043
12.3
0
Choromoro
ClLCH
SS
LDP
0.056
17.1
2
Sunchal
ClSu
SS
LDP
0.063
19.5
1
El Siambón
ClLS
SS
LDP
0.057
18.1
0
La Florida-Provincial Park
ClPPFL
SS
UP
0.157
41.3
16
Los Pizarros
ClLPi
SS
LDP
0.049
14.3
0
13 Patterns of Neutral Genetic Variation for High-Value Cedar Species…
polymorphic AFLP (amplified fragment length polymorphism) markers. Highpriority areas for conservation and domestication purposes, both from protected
areas and private fields, were identified (Inza et al. 2012).
13.2.1.1 Genetic Diversity and Differentiation
The average value of genetic diversity of C. angustifolia in Argentina is low
(Ht = 0.135, He = 0.087; GenAlEx6, Peakall and Smouse 2006), which is consistent
with the fact of being the southernmost edge of its continental range (Table 13.1,
Fig. 13.1). Additionally, C. angustifolia populations are isolated, with low density
of individuals per population and different levels of disturbance, all features of species with low levels of genetic diversity (Hamrick et al. 1992; Young and Boyle 2000).
Several indices, such as mean expected heterozygosity (He), percentage of polymorphic loci (PPL), and the number of exclusive bands (EB), were used to assess
genetic population diversity. The results showed that genetic population variability
decreased with increasing latitude and disturbance level (Table 13.2); genetic diversity is much higher in the northern populations than in central and southern populations, though northern populations display similar or greater levels of disturbance
than those located in the south. However, La Florida Provincial Park, which is
located in the south (Table 13.1; Fig. 13.1), was a singular population displaying
genetic diversity levels comparable with the level found in populations located in
the north (Table 13.2).
Table 13.2 Genetic diversity of 14 C. angustifolia populations in the Yungas with locality,
population code, latitudinal sectors (LS: SS southern sector, CS central sector, NS northern sector)
of Yungas (Brown et al. 2001), disturbance levels (DL: UP undisturbed populations, LDP low
disturbed populations, DP disturbed populations). He means expected heterozigosity, PPLp
percentage of polymorphic loci per population, EB number of exclusive bands
Locality
Code
LS
DL
He
PPL P (%)
EB
El Nogalar-Natural Reserve
ClND
NS
DP
0.119
41.0
9
Argencampo
ClArD
NS
DP
0.113
32.4
7
Baritú-National Park
ClPND
NS
UP
0.168
65.5
36
Empresa 3R
Cl3RD
NS
DP
0.107
33.5
5
San Andrés
ClSA
NS
LDP
0.088
30.7
5
Calilegua-National Park
CLPNC
CS
DP
0.062
17.8
1
La Ramada
ClLLR
CS
LDP
0.071
21.2
2
El Arenal
ClAL
CS
LDP
0.059
17.1
0
Metán
ClMT
SS
DP
0.043
12.3
0
Choromoro
ClLCH
SS
LDP
0.056
17.1
2
Sunchal
ClSu
SS
LDP
0.063
19.5
1
El Siambón
ClLS
SS
LDP
0.057
18.1
0
La Florida-Provincial Park
ClPPFL
SS
UP
0.157
41.3
16
Los Pizarros
ClLPi
SS
LDP
0.049
14.3
0
13 Patterns of Neutral Genetic Variation for High-Value Cedar Species…