

263
9.5 Phenological Analysis of a Stand and Its Application in a
Hybrid Swarm of Prosopis spp.
Another useful method for the study of the mating system is to incorporate the floral
phenology factor into the analysis. Expected genotype frequencies are obtained in
the offspring that already involve the phenological behavior of the stand, empirically observed.
Accordingly, a study was performed (Córdoba and Verga 2006) in two periods
(2002–2003 and 2003–2004) in a plot located in the Provincial Park Chancaní
(Province of Córdoba), in the Arid Chaco (31° 19′ S- 65° 27′ W). The plot consisted
of 112 algarrobos’ trees and is located in an abandoned farm with 25 years of recolonization of the native forest. There come into contact both pure P. chilensis and
P. flexuosa trees, and numerous individuals with intermediate morphological
characteristics.
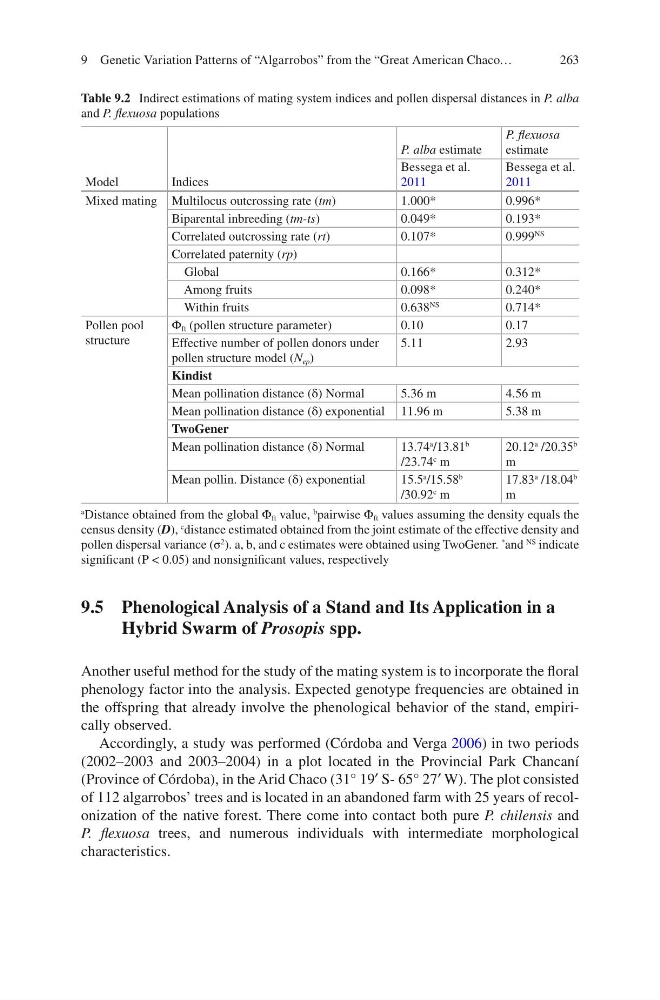
Table 9.2 Indirect estimations of mating system indices and pollen dispersal distances in P. alba
and P. flexuosa populations
Model
Indices
P. alba estimate
P. flexuosa
estimate
Bessega et al.
2011
Bessega et al.
2011
Mixed mating Multilocus outcrossing rate (tm)
1.000*
0.996*
Biparental inbreeding (tm-ts)
0.049*
0.193*
Correlated outcrossing rate (rt)
0.107*
0.999
NS
Correlated paternity (rp)
Global
0.166*
0.312*
Among fruits
0.098*
0.240*
Within fruits
0.638
NS
0.714*
Pollen pool
structure
Φ ft (pollen structure parameter)
0.10
0.17
Effective number of pollen donors under
pollen structure model (N ep )
5.11
2.93
Kindist
Mean pollination distance (δ) Normal
5.36 m
4.56 m
Mean pollination distance (δ) exponential 11.96 m
5.38 m
TwoGener
Mean pollination distance (δ) Normal
13.74
a /13.81
b
/23.74
c m
20.12
a /20.35
b
m
Mean pollin. Distance (δ) exponential
15.5
a /15.58
b
/30.92
c m
17.83
a /18.04
b
m
a Distance obtained from the global Φ ft value,
b pairwise Φ ft values assuming the density equals the
census density (D),
c
distance estimated obtained from the joint estimate of the effective density and
pollen dispersal variance (σ
2 ). a, b, and c estimates were obtained using TwoGener.
*
and
NS indicate
significant (P < 0.05) and nonsignificant values, respectively
9 Genetic Variation Patterns of “Algarrobos” from the “Great American Chaco…
9.5 Phenological Analysis of a Stand and Its Application in a
Hybrid Swarm of Prosopis spp.
Another useful method for the study of the mating system is to incorporate the floral
phenology factor into the analysis. Expected genotype frequencies are obtained in
the offspring that already involve the phenological behavior of the stand, empirically observed.
Accordingly, a study was performed (Córdoba and Verga 2006) in two periods
(2002–2003 and 2003–2004) in a plot located in the Provincial Park Chancaní
(Province of Córdoba), in the Arid Chaco (31° 19′ S- 65° 27′ W). The plot consisted
of 112 algarrobos’ trees and is located in an abandoned farm with 25 years of recolonization of the native forest. There come into contact both pure P. chilensis and
P. flexuosa trees, and numerous individuals with intermediate morphological
characteristics.
Table 9.2 Indirect estimations of mating system indices and pollen dispersal distances in P. alba
and P. flexuosa populations
Model
Indices
P. alba estimate
P. flexuosa
estimate
Bessega et al.
2011
Bessega et al.
2011
Mixed mating Multilocus outcrossing rate (tm)
1.000*
0.996*
Biparental inbreeding (tm-ts)
0.049*
0.193*
Correlated outcrossing rate (rt)
0.107*
0.999
NS
Correlated paternity (rp)
Global
0.166*
0.312*
Among fruits
0.098*
0.240*
Within fruits
0.638
NS
0.714*
Pollen pool
structure
Φ ft (pollen structure parameter)
0.10
0.17
Effective number of pollen donors under
pollen structure model (N ep )
5.11
2.93
Kindist
Mean pollination distance (δ) Normal
5.36 m
4.56 m
Mean pollination distance (δ) exponential 11.96 m
5.38 m
TwoGener
Mean pollination distance (δ) Normal
13.74
a /13.81
b
/23.74
c m
20.12
a /20.35
b
m
Mean pollin. Distance (δ) exponential
15.5
a /15.58
b
/30.92
c m
17.83
a /18.04
b
m
a Distance obtained from the global Φ ft value,
b pairwise Φ ft values assuming the density equals the
census density (D),
c
distance estimated obtained from the joint estimate of the effective density and
pollen dispersal variance (σ
2 ). a, b, and c estimates were obtained using TwoGener.
*
and
NS indicate
significant (P < 0.05) and nonsignificant values, respectively
9 Genetic Variation Patterns of “Algarrobos” from the “Great American Chaco…