

260
markers that are under selection were excluded from the analysis, no genetic
structure was observed. This suggests that genetic differences and structuring
observed among populations are mainly due to the processes of local adaptation
and, to a lesser extent, to stochastic processes such as genetic drift. In this context,
these processes of local adaptation should be taken into account when identifying
the most appropriate seed sources best adapted to each particular condition where
forest plantations, reforestation plants, or ecosystem restoration will be implemented
(López Lauenstein 2019).
An alternative approach was also applied in order to detect evidences of local
adaptation in P. alba (Bessega et al. 2015). As proposed by Merila and Crnokrak
(2001), the univariate neutrality test analysis based on the comparison of the levels
of phenotypic and molecular differentiation can contribute to discriminate selection
from genetic drift effects over a group of quantitative traits. Following the classical
interpretation, if F ST = Q ST , there is no need to invoke natural selection and differentiation is explained simply by gene flow-genetic drift interaction; if Q ST > F ST , positive directional natural selection favoring different phenotypes in different
populations is suspected; and Q ST < F ST suggests stabilizing selection favoring the
same phenotype in different populations (Merila and Crnokrak 2001).
The study was conducted in an orchard established in 1991 in San Carlos
(Province of Santiago del Estero) initiated from seeds collected from open pollinated
trees (half-sib families) belonging to 8 sampling sites of northern Argentina:
Añatuya, Castelli, Gato Colorado, Ibarreta, Pinto, Quimili, Rio Dulce Irrigation
Zone, and Sumampa. A total of 142 individuals belonging to 32 different families,
7 replicates (blocks), and 4 trees per replicate (with a 4 × 4 m spacing) were sampled for the present study.
In order to apply the Q ST -F ST comparison tests, all the individuals were genotyped
using 6 unlinked microsatellites markers (Mo05, Mo07; Mo08, Mo09, Mo13, and
Mo16) and characterized morphologically. Three life history traits (height [H],
basal diameter [BD], biomass [BMS]), 11 leaf characters (petiole length [PEL],
number of pairs of leaflets per pinna [NLP], pinna length [PIL], spine length [SPL],
number of pinnae [NP]), leaflet length [LEL], leaflet length/width [LEL/LEW],
leaflet falcate [LEF], leaflet apex [LEX], and leaflet apex/total area [LEX/LEA]),
and the spine length (SPL) were measured (see details in Bessega et al. (2009)).
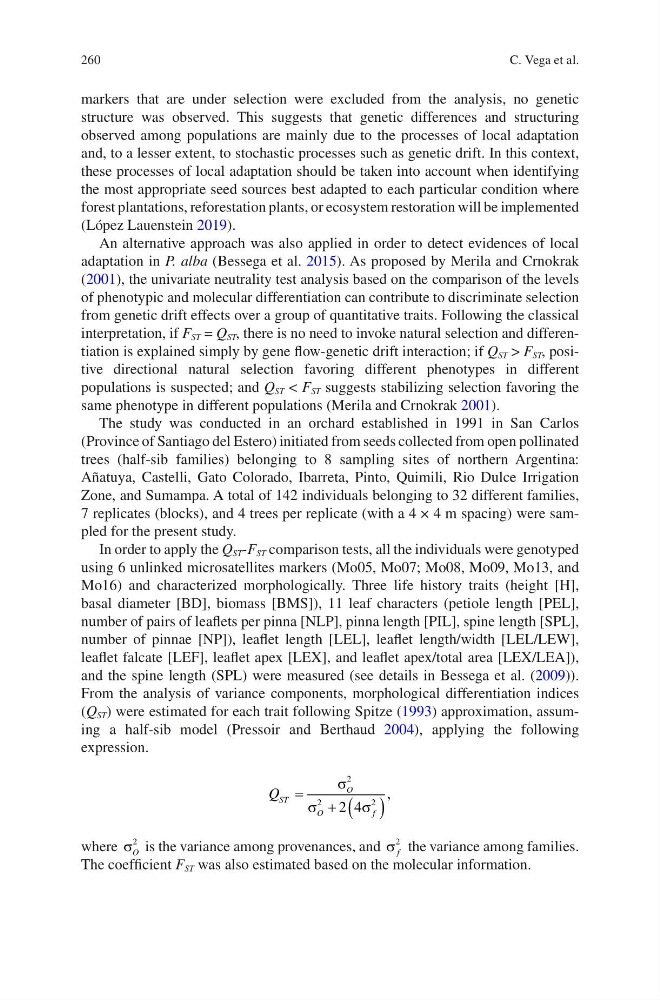
From the analysis of variance components, morphological differentiation indices
(Q ST ) were estimated for each trait following Spitze (1993) approximation, assuming a half-sib model (Pressoir and Berthaud 2004), applying the following
expression.
Q ST
O
O
f
=
+ ( )
σ
σ
σ
2
2
2
2 4
,
where σ O
2 is the variance among provenances, and σ f
2 the variance among families.
The coefficient F ST was also estimated based on the molecular information.
C. Vega et al.
markers that are under selection were excluded from the analysis, no genetic
structure was observed. This suggests that genetic differences and structuring
observed among populations are mainly due to the processes of local adaptation
and, to a lesser extent, to stochastic processes such as genetic drift. In this context,
these processes of local adaptation should be taken into account when identifying
the most appropriate seed sources best adapted to each particular condition where
forest plantations, reforestation plants, or ecosystem restoration will be implemented
(López Lauenstein 2019).
An alternative approach was also applied in order to detect evidences of local
adaptation in P. alba (Bessega et al. 2015). As proposed by Merila and Crnokrak
(2001), the univariate neutrality test analysis based on the comparison of the levels
of phenotypic and molecular differentiation can contribute to discriminate selection
from genetic drift effects over a group of quantitative traits. Following the classical
interpretation, if F ST = Q ST , there is no need to invoke natural selection and differentiation is explained simply by gene flow-genetic drift interaction; if Q ST > F ST , positive directional natural selection favoring different phenotypes in different
populations is suspected; and Q ST < F ST suggests stabilizing selection favoring the
same phenotype in different populations (Merila and Crnokrak 2001).
The study was conducted in an orchard established in 1991 in San Carlos
(Province of Santiago del Estero) initiated from seeds collected from open pollinated
trees (half-sib families) belonging to 8 sampling sites of northern Argentina:
Añatuya, Castelli, Gato Colorado, Ibarreta, Pinto, Quimili, Rio Dulce Irrigation
Zone, and Sumampa. A total of 142 individuals belonging to 32 different families,
7 replicates (blocks), and 4 trees per replicate (with a 4 × 4 m spacing) were sampled for the present study.
In order to apply the Q ST -F ST comparison tests, all the individuals were genotyped
using 6 unlinked microsatellites markers (Mo05, Mo07; Mo08, Mo09, Mo13, and
Mo16) and characterized morphologically. Three life history traits (height [H],
basal diameter [BD], biomass [BMS]), 11 leaf characters (petiole length [PEL],
number of pairs of leaflets per pinna [NLP], pinna length [PIL], spine length [SPL],
number of pinnae [NP]), leaflet length [LEL], leaflet length/width [LEL/LEW],
leaflet falcate [LEF], leaflet apex [LEX], and leaflet apex/total area [LEX/LEA]),
and the spine length (SPL) were measured (see details in Bessega et al. (2009)).
From the analysis of variance components, morphological differentiation indices
(Q ST ) were estimated for each trait following Spitze (1993) approximation, assuming a half-sib model (Pressoir and Berthaud 2004), applying the following
expression.
Q ST
O
O
f
=
+ ( )
σ
σ
σ
2
2
2
2 4
,
where σ O
2 is the variance among provenances, and σ f
2 the variance among families.
The coefficient F ST was also estimated based on the molecular information.
C. Vega et al.