

218
most humid sites in the east, to the driest ones in the west and is the main factor in
defining the subregions and productive activities, also marking a steep climatic gradient (Spensley et al. 2013).
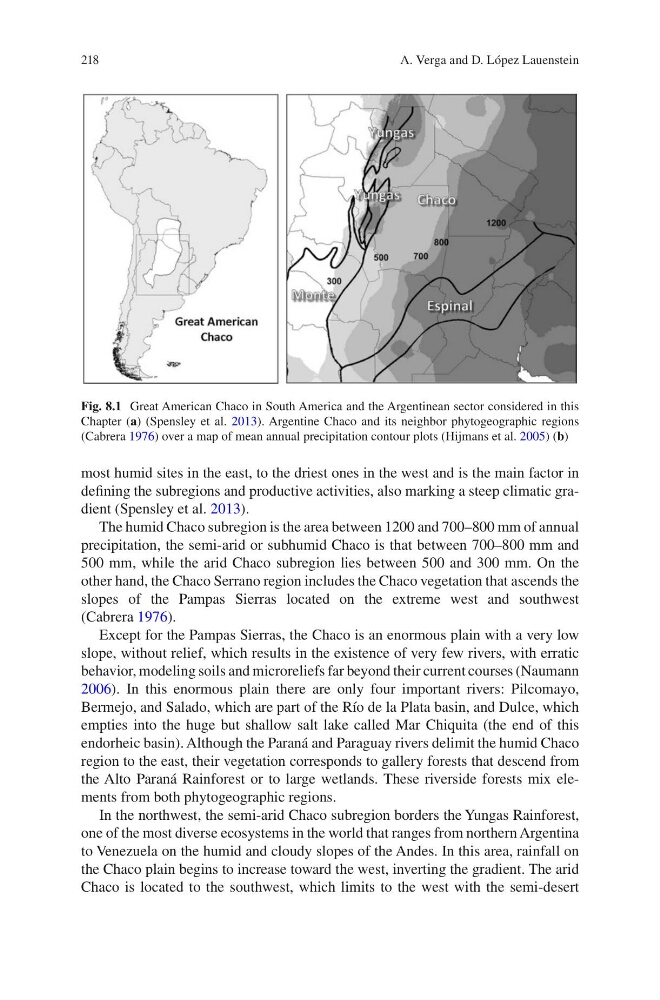
The humid Chaco subregion is the area between 1200 and 700–800 mm of annual
precipitation, the semi-arid or subhumid Chaco is that between 700–800 mm and
500 mm, while the arid Chaco subregion lies between 500 and 300 mm. On the
other hand, the Chaco Serrano region includes the Chaco vegetation that ascends the
slopes of the Pampas Sierras located on the extreme west and southwest
(Cabrera 1976).
Except for the Pampas Sierras, the Chaco is an enormous plain with a very low
slope, without relief, which results in the existence of very few rivers, with erratic
behavior, modeling soils and microreliefs far beyond their current courses (Naumann
2006). In this enormous plain there are only four important rivers: Pilcomayo,
Bermejo, and Salado, which are part of the Río de la Plata basin, and Dulce, which
empties into the huge but shallow salt lake called Mar Chiquita (the end of this
endorheic basin). Although the Paraná and Paraguay rivers delimit the humid Chaco
region to the east, their vegetation corresponds to gallery forests that descend from
the Alto Paraná Rainforest or to large wetlands. These riverside forests mix elements from both phytogeographic regions.
In the northwest, the semi-arid Chaco subregion borders the Yungas Rainforest,
one of the most diverse ecosystems in the world that ranges from northern Argentina
to Venezuela on the humid and cloudy slopes of the Andes. In this area, rainfall on
the Chaco plain begins to increase toward the west, inverting the gradient. The arid
Chaco is located to the southwest, which limits to the west with the semi-desert
Fig. 8.1 Great American Chaco in South America and the Argentinean sector considered in this
Chapter (a) (Spensley et al. 2013). Argentine Chaco and its neighbor phytogeographic regions
(Cabrera 1976) over a map of mean annual precipitation contour plots (Hijmans et al. 2005) (b)
A. Verga and D. López Lauenstein
most humid sites in the east, to the driest ones in the west and is the main factor in
defining the subregions and productive activities, also marking a steep climatic gradient (Spensley et al. 2013).
The humid Chaco subregion is the area between 1200 and 700–800 mm of annual
precipitation, the semi-arid or subhumid Chaco is that between 700–800 mm and
500 mm, while the arid Chaco subregion lies between 500 and 300 mm. On the
other hand, the Chaco Serrano region includes the Chaco vegetation that ascends the
slopes of the Pampas Sierras located on the extreme west and southwest
(Cabrera 1976).
Except for the Pampas Sierras, the Chaco is an enormous plain with a very low
slope, without relief, which results in the existence of very few rivers, with erratic
behavior, modeling soils and microreliefs far beyond their current courses (Naumann
2006). In this enormous plain there are only four important rivers: Pilcomayo,
Bermejo, and Salado, which are part of the Río de la Plata basin, and Dulce, which
empties into the huge but shallow salt lake called Mar Chiquita (the end of this
endorheic basin). Although the Paraná and Paraguay rivers delimit the humid Chaco
region to the east, their vegetation corresponds to gallery forests that descend from
the Alto Paraná Rainforest or to large wetlands. These riverside forests mix elements from both phytogeographic regions.
In the northwest, the semi-arid Chaco subregion borders the Yungas Rainforest,
one of the most diverse ecosystems in the world that ranges from northern Argentina
to Venezuela on the humid and cloudy slopes of the Andes. In this area, rainfall on
the Chaco plain begins to increase toward the west, inverting the gradient. The arid
Chaco is located to the southwest, which limits to the west with the semi-desert
Fig. 8.1 Great American Chaco in South America and the Argentinean sector considered in this
Chapter (a) (Spensley et al. 2013). Argentine Chaco and its neighbor phytogeographic regions
(Cabrera 1976) over a map of mean annual precipitation contour plots (Hijmans et al. 2005) (b)
A. Verga and D. López Lauenstein