

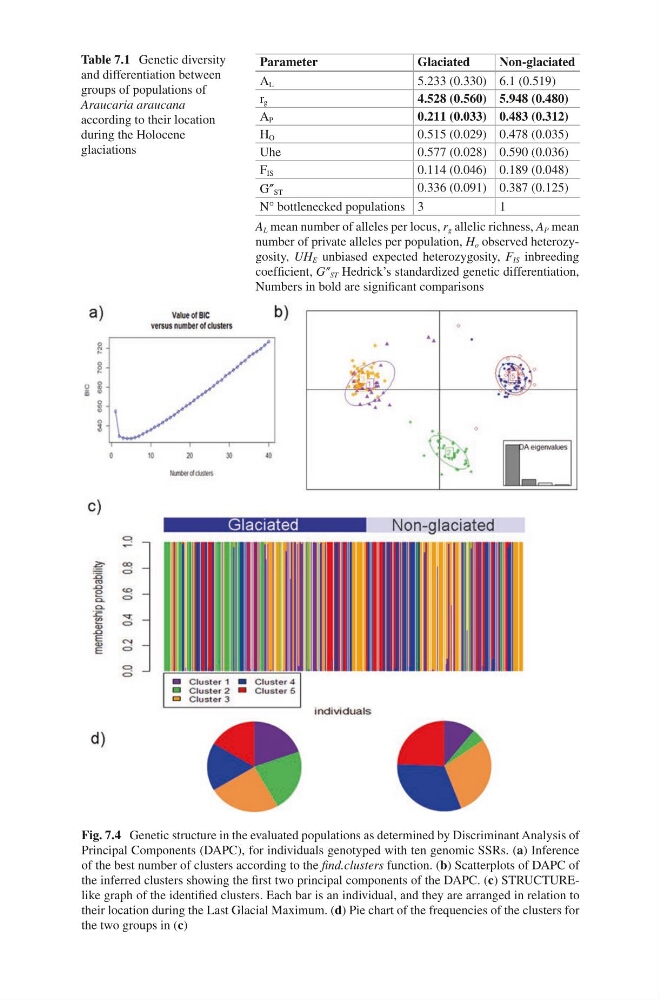
Table 7.1 Genetic diversity
and differentiation between
groups of populations of
Araucaria araucana
according to their location
during the Holocene
glaciations
Parameter
Glaciated
Non-glaciated
A L
5.233 (0.330) 6.1 (0.519)
r g
4.528 (0.560) 5.948 (0.480)
A P
0.211 (0.033) 0.483 (0.312)
H O
0.515 (0.029) 0.478 (0.035)
Uhe
0.577 (0.028) 0.590 (0.036)
F IS
0.114 (0.046) 0.189 (0.048)
G″ ST
0.336 (0.091) 0.387 (0.125)
N° bottlenecked populations 3
1
A L mean number of alleles per locus, r g allelic richness, A P mean
number of private alleles per population, H o observed heterozygosity, UH E unbiased expected heterozygosity, F IS inbreeding
coefficient, G″ ST Hedrick’s standardized genetic differentiation,
Numbers in bold are significant comparisons
Fig. 7.4 Genetic structure in the evaluated populations as determined by Discriminant Analysis of
Principal Components (DAPC), for individuals genotyped with ten genomic SSRs. (a) Inference
of the best number of clusters according to the find.clusters function. (b) Scatterplots of DAPC of
the inferred clusters showing the first two principal components of the DAPC. (c) STRUCTURElike graph of the identified clusters. Each bar is an individual, and they are arranged in relation to
their location during the Last Glacial Maximum. (d) Pie chart of the frequencies of the clusters for
the two groups in (c)
and differentiation between
groups of populations of
Araucaria araucana
according to their location
during the Holocene
glaciations
Parameter
Glaciated
Non-glaciated
A L
5.233 (0.330) 6.1 (0.519)
r g
4.528 (0.560) 5.948 (0.480)
A P
0.211 (0.033) 0.483 (0.312)
H O
0.515 (0.029) 0.478 (0.035)
Uhe
0.577 (0.028) 0.590 (0.036)
F IS
0.114 (0.046) 0.189 (0.048)
G″ ST
0.336 (0.091) 0.387 (0.125)
N° bottlenecked populations 3
1
A L mean number of alleles per locus, r g allelic richness, A P mean
number of private alleles per population, H o observed heterozygosity, UH E unbiased expected heterozygosity, F IS inbreeding
coefficient, G″ ST Hedrick’s standardized genetic differentiation,
Numbers in bold are significant comparisons
Fig. 7.4 Genetic structure in the evaluated populations as determined by Discriminant Analysis of
Principal Components (DAPC), for individuals genotyped with ten genomic SSRs. (a) Inference
of the best number of clusters according to the find.clusters function. (b) Scatterplots of DAPC of
the inferred clusters showing the first two principal components of the DAPC. (c) STRUCTURElike graph of the identified clusters. Each bar is an individual, and they are arranged in relation to
their location during the Last Glacial Maximum. (d) Pie chart of the frequencies of the clusters for
the two groups in (c)