

128
A comparison between logged and non-logged stands of N. pumilio was made
through the estimation of genetic diversity of adults and their regeneration by means
of nuclear microsatellites (Soliani et al. 2016). Three pairs of stands from areas
around 42° S, which were reported as strongly intervened and degraded after a high
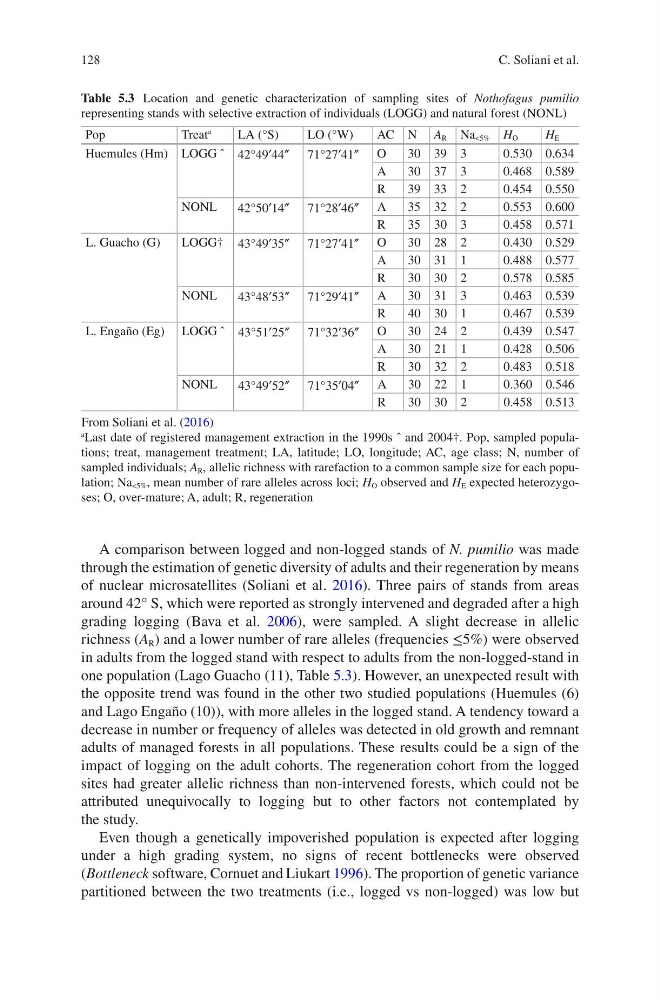
grading logging (Bava et al. 2006), were sampled. A slight decrease in allelic
richness (A R ) and a lower number of rare alleles (frequencies ≤5%) were observed
in adults from the logged stand with respect to adults from the non-logged-stand in
one population (Lago Guacho (11), Table 5.3). However, an unexpected result with
the opposite trend was found in the other two studied populations (Huemules (6)
and Lago Engaño (10)), with more alleles in the logged stand. A tendency toward a
decrease in number or frequency of alleles was detected in old growth and remnant
adults of managed forests in all populations. These results could be a sign of the
impact of logging on the adult cohorts. The regeneration cohort from the logged
sites had greater allelic richness than non-intervened forests, which could not be
attributed unequivocally to logging but to other factors not contemplated by
the study.
Even though a genetically impoverished population is expected after logging
under a high grading system, no signs of recent bottlenecks were observed
(Bottleneck software, Cornuet and Liukart 1996). The proportion of genetic variance
partitioned between the two treatments (i.e., logged vs non-logged) was low but
Table 5.3 Location and genetic characterization of sampling sites of Nothofagus pumilio
representing stands with selective extraction of individuals (LOGG) and natural forest (NONL)
Pop
Treat
a
LA (°S)
LO (°W)
AC N A R Na <5% H O
H E
Huemules (Hm) LOGG ˆ 42°49′44″ 71°27′41″ O
30 39 3
0.530 0.634
A
30 37 3
0.468 0.589
R
39 33 2
0.454 0.550
NONL
42°50′14″ 71°28′46″ A
35 32 2
0.553 0.600
R
35 30 3
0.458 0.571
L. Guacho (G)
LOGG† 43°49′35″ 71°27′41″ O
30 28 2
0.430 0.529
A
30 31 1
0.488 0.577
R
30 30 2
0.578 0.585
NONL
43°48′53″ 71°29′41″ A
30 31 3
0.463 0.539
R
40 30 1
0.467 0.539
L. Engaño (Eg) LOGG ˆ 43°51′25″ 71°32′36″ O
30 24 2
0.439 0.547
A
30 21 1
0.428 0.506
R
30 32 2
0.483 0.518
NONL
43°49′52″ 71°35′04″ A
30 22 1
0.360 0.546
R
30 30 2
0.458 0.513
From Soliani et al. (2016)
a Last date of registered management extraction in the 1990s ˆ and 2004†. Pop, sampled populations; treat, management treatment; LA, latitude; LO, longitude; AC, age class; N, number of
sampled individuals; A R , allelic richness with rarefaction to a common sample size for each population; Na <5% , mean number of rare alleles across loci; H O observed and H E expected heterozygoses; O, over-mature; A, adult; R, regeneration
C. Soliani et al.
A comparison between logged and non-logged stands of N. pumilio was made
through the estimation of genetic diversity of adults and their regeneration by means
of nuclear microsatellites (Soliani et al. 2016). Three pairs of stands from areas
around 42° S, which were reported as strongly intervened and degraded after a high
grading logging (Bava et al. 2006), were sampled. A slight decrease in allelic
richness (A R ) and a lower number of rare alleles (frequencies ≤5%) were observed
in adults from the logged stand with respect to adults from the non-logged-stand in
one population (Lago Guacho (11), Table 5.3). However, an unexpected result with
the opposite trend was found in the other two studied populations (Huemules (6)
and Lago Engaño (10)), with more alleles in the logged stand. A tendency toward a
decrease in number or frequency of alleles was detected in old growth and remnant
adults of managed forests in all populations. These results could be a sign of the
impact of logging on the adult cohorts. The regeneration cohort from the logged
sites had greater allelic richness than non-intervened forests, which could not be
attributed unequivocally to logging but to other factors not contemplated by
the study.
Even though a genetically impoverished population is expected after logging
under a high grading system, no signs of recent bottlenecks were observed
(Bottleneck software, Cornuet and Liukart 1996). The proportion of genetic variance
partitioned between the two treatments (i.e., logged vs non-logged) was low but
Table 5.3 Location and genetic characterization of sampling sites of Nothofagus pumilio
representing stands with selective extraction of individuals (LOGG) and natural forest (NONL)
Pop
Treat
a
LA (°S)
LO (°W)
AC N A R Na <5% H O
H E
Huemules (Hm) LOGG ˆ 42°49′44″ 71°27′41″ O
30 39 3
0.530 0.634
A
30 37 3
0.468 0.589
R
39 33 2
0.454 0.550
NONL
42°50′14″ 71°28′46″ A
35 32 2
0.553 0.600
R
35 30 3
0.458 0.571
L. Guacho (G)
LOGG† 43°49′35″ 71°27′41″ O
30 28 2
0.430 0.529
A
30 31 1
0.488 0.577
R
30 30 2
0.578 0.585
NONL
43°48′53″ 71°29′41″ A
30 31 3
0.463 0.539
R
40 30 1
0.467 0.539
L. Engaño (Eg) LOGG ˆ 43°51′25″ 71°32′36″ O
30 24 2
0.439 0.547
A
30 21 1
0.428 0.506
R
30 32 2
0.483 0.518
NONL
43°49′52″ 71°35′04″ A
30 22 1
0.360 0.546
R
30 30 2
0.458 0.513
From Soliani et al. (2016)
a Last date of registered management extraction in the 1990s ˆ and 2004†. Pop, sampled populations; treat, management treatment; LA, latitude; LO, longitude; AC, age class; N, number of
sampled individuals; A R , allelic richness with rarefaction to a common sample size for each population; Na <5% , mean number of rare alleles across loci; H O observed and H E expected heterozygoses; O, over-mature; A, adult; R, regeneration
C. Soliani et al.