

100
4.3.1 Seed and Germination Analyses
Germination is a vital process subjected to natural selection, and therefore the analysis of variation in related seed traits is relevant to understand its modulation.
Aiming to unravel the effects of several seed traits on adaptation processes of roble
pellín, a study on natural populations was done (Barbero 2014). Seeds were collected from 116 trees corresponding to eight populations of roble pellín, covering
the entire distribution area of this species in Argentina. The proportion and weight
of filled seeds were measured, and, subsequently, a germination assay was performed in germination chambers, adjusting a cumulative germination curve per
mother tree by means of nonlinear regression (Gompertz function). Mean proportion of filled seeds per population varied between 4% and 57%. Differences among
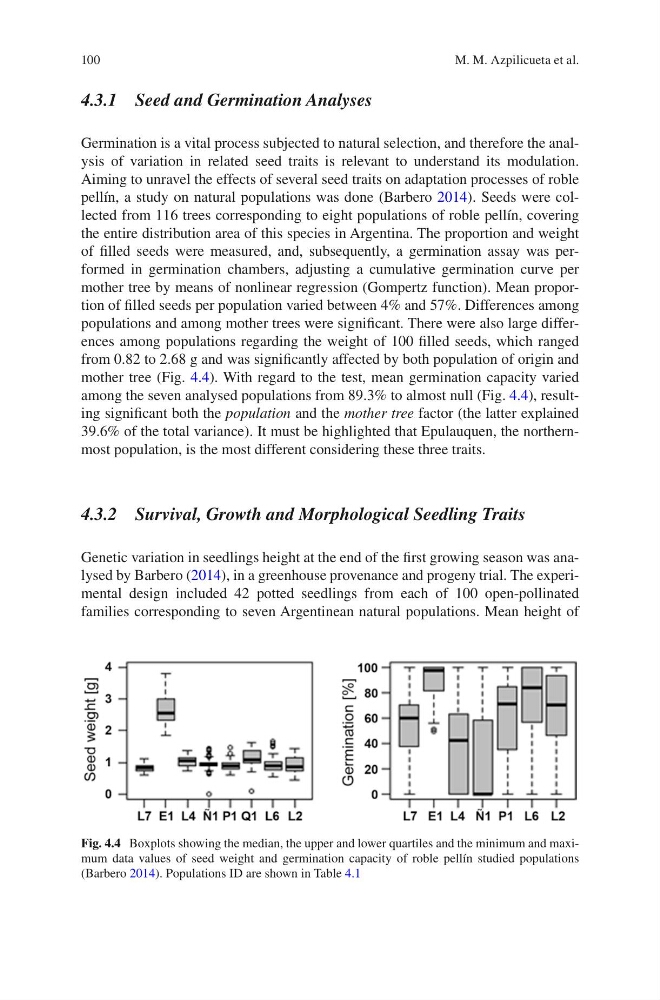
populations and among mother trees were significant. There were also large differences among populations regarding the weight of 100 filled seeds, which ranged
from 0.82 to 2.68 g and was significantly affected by both population of origin and
mother tree (Fig. 4.4). With regard to the test, mean germination capacity varied
among the seven analysed populations from 89.3% to almost null (Fig. 4.4), resulting significant both the population and the mother tree factor (the latter explained
39.6% of the total variance). It must be highlighted that Epulauquen, the northernmost population, is the most different considering these three traits.
4.3.2 Survival, Growth and Morphological Seedling Traits
Genetic variation in seedlings height at the end of the first growing season was analysed by Barbero (2014), in a greenhouse provenance and progeny trial. The experimental design included 42 potted seedlings from each of 100 open-pollinated
families corresponding to seven Argentinean natural populations. Mean height of
Fig. 4.4 Boxplots showing the median, the upper and lower quartiles and the minimum and maximum data values of seed weight and germination capacity of roble pellín studied populations
(Barbero 2014). Populations ID are shown in Table 4.1
M. M. Azpilicueta et al.
4.3.1 Seed and Germination Analyses
Germination is a vital process subjected to natural selection, and therefore the analysis of variation in related seed traits is relevant to understand its modulation.
Aiming to unravel the effects of several seed traits on adaptation processes of roble
pellín, a study on natural populations was done (Barbero 2014). Seeds were collected from 116 trees corresponding to eight populations of roble pellín, covering
the entire distribution area of this species in Argentina. The proportion and weight
of filled seeds were measured, and, subsequently, a germination assay was performed in germination chambers, adjusting a cumulative germination curve per
mother tree by means of nonlinear regression (Gompertz function). Mean proportion of filled seeds per population varied between 4% and 57%. Differences among
populations and among mother trees were significant. There were also large differences among populations regarding the weight of 100 filled seeds, which ranged
from 0.82 to 2.68 g and was significantly affected by both population of origin and
mother tree (Fig. 4.4). With regard to the test, mean germination capacity varied
among the seven analysed populations from 89.3% to almost null (Fig. 4.4), resulting significant both the population and the mother tree factor (the latter explained
39.6% of the total variance). It must be highlighted that Epulauquen, the northernmost population, is the most different considering these three traits.
4.3.2 Survival, Growth and Morphological Seedling Traits
Genetic variation in seedlings height at the end of the first growing season was analysed by Barbero (2014), in a greenhouse provenance and progeny trial. The experimental design included 42 potted seedlings from each of 100 open-pollinated
families corresponding to seven Argentinean natural populations. Mean height of
Fig. 4.4 Boxplots showing the median, the upper and lower quartiles and the minimum and maximum data values of seed weight and germination capacity of roble pellín studied populations
(Barbero 2014). Populations ID are shown in Table 4.1
M. M. Azpilicueta et al.