

96
4.2.2 Level of Genetic Diversity as an Indicator
for Conservation
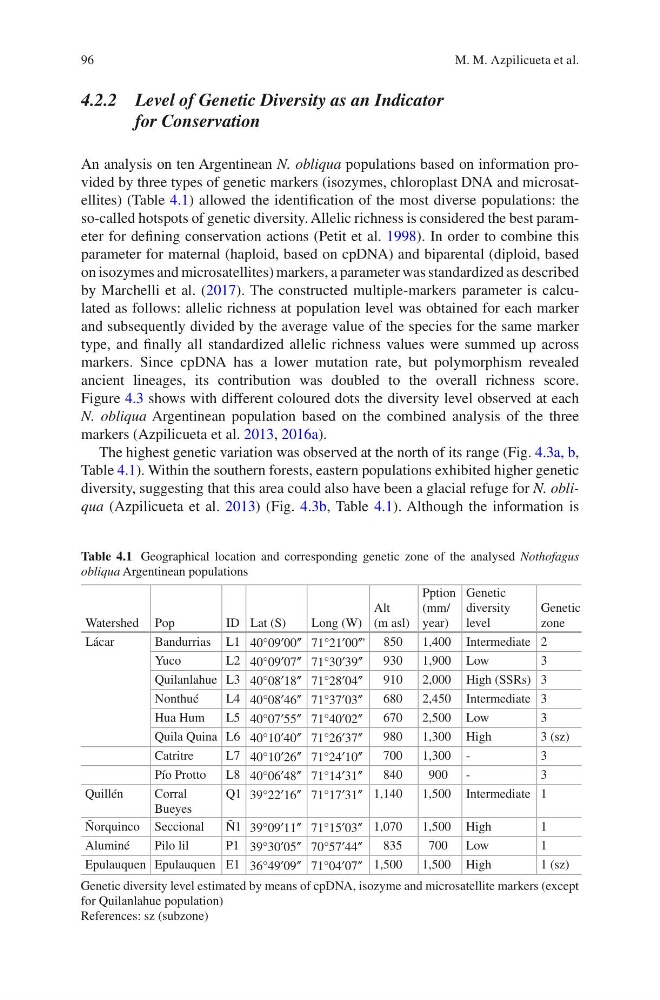
An analysis on ten Argentinean N. obliqua populations based on information provided by three types of genetic markers (isozymes, chloroplast DNA and microsatellites) (Table 4.1) allowed the identification of the most diverse populations: the
so-called hotspots of genetic diversity. Allelic richness is considered the best parameter for defining conservation actions (Petit et al. 1998). In order to combine this
parameter for maternal (haploid, based on cpDNA) and biparental (diploid, based
on isozymes and microsatellites) markers, a parameter was standardized as described
by Marchelli et al. (2017). The constructed multiple-markers parameter is calculated as follows: allelic richness at population level was obtained for each marker
and subsequently divided by the average value of the species for the same marker
type, and finally all standardized allelic richness values were summed up across
markers. Since cpDNA has a lower mutation rate, but polymorphism revealed
ancient lineages, its contribution was doubled to the overall richness score.
Figure 4.3 shows with different coloured dots the diversity level observed at each
N. obliqua Argentinean population based on the combined analysis of the three
markers (Azpilicueta et al. 2013, 2016a).
The highest genetic variation was observed at the north of its range (Fig. 4.3a, b,
Table 4.1). Within the southern forests, eastern populations exhibited higher genetic
diversity, suggesting that this area could also have been a glacial refuge for N. obliqua (Azpilicueta et al. 2013) (Fig. 4.3b, Table 4.1). Although the information is
Table 4.1 Geographical location and corresponding genetic zone of the analysed Nothofagus
obliqua Argentinean populations
Watershed Pop
ID Lat (S)
Long (W)
Alt
(m asl)
Pption
(mm/
year)
Genetic
diversity
level
Genetic
zone
Lácar
Bandurrias L1 40°09′00″ 71°21′00″' 850
1,400 Intermediate 2
Yuco
L2 40°09′07″ 71°30′39″
930
1,900 Low
3
Quilanlahue L3 40°08′18″ 71°28′04″
910
2,000 High (SSRs) 3
Nonthué
L4 40°08′46″ 71°37′03″
680
2,450 Intermediate 3
Hua Hum
L5 40°07′55″ 71°40′02″
670
2,500 Low
3
Quila Quina L6 40°10′40″ 71°26′37″
980
1,300 High
3 (sz)
Catritre
L7 40°10′26″ 71°24′10″
700
1,300 -
3
Pío Protto
L8 40°06′48″ 71°14′31″
840
900 -
3
Quillén
Corral
Bueyes
Q1 39°22′16″ 71°17′31″ 1,140
1,500 Intermediate 1
Ñorquinco Seccional
Ñ1 39°09′11″ 71°15′03″ 1,070
1,500 High
1
Aluminé
Pilo lil
P1 39°30′05″ 70°57′44″
835
700 Low
1
Epulauquen Epulauquen E1 36°49′09″ 71°04′07″ 1,500
1,500 High
1 (sz)
Genetic diversity level estimated by means of cpDNA, isozyme and microsatellite markers (except
for Quilanlahue population)
References: sz (subzone)
M. M. Azpilicueta et al.
4.2.2 Level of Genetic Diversity as an Indicator
for Conservation
An analysis on ten Argentinean N. obliqua populations based on information provided by three types of genetic markers (isozymes, chloroplast DNA and microsatellites) (Table 4.1) allowed the identification of the most diverse populations: the
so-called hotspots of genetic diversity. Allelic richness is considered the best parameter for defining conservation actions (Petit et al. 1998). In order to combine this
parameter for maternal (haploid, based on cpDNA) and biparental (diploid, based
on isozymes and microsatellites) markers, a parameter was standardized as described
by Marchelli et al. (2017). The constructed multiple-markers parameter is calculated as follows: allelic richness at population level was obtained for each marker
and subsequently divided by the average value of the species for the same marker
type, and finally all standardized allelic richness values were summed up across
markers. Since cpDNA has a lower mutation rate, but polymorphism revealed
ancient lineages, its contribution was doubled to the overall richness score.
Figure 4.3 shows with different coloured dots the diversity level observed at each
N. obliqua Argentinean population based on the combined analysis of the three
markers (Azpilicueta et al. 2013, 2016a).
The highest genetic variation was observed at the north of its range (Fig. 4.3a, b,
Table 4.1). Within the southern forests, eastern populations exhibited higher genetic
diversity, suggesting that this area could also have been a glacial refuge for N. obliqua (Azpilicueta et al. 2013) (Fig. 4.3b, Table 4.1). Although the information is
Table 4.1 Geographical location and corresponding genetic zone of the analysed Nothofagus
obliqua Argentinean populations
Watershed Pop
ID Lat (S)
Long (W)
Alt
(m asl)
Pption
(mm/
year)
Genetic
diversity
level
Genetic
zone
Lácar
Bandurrias L1 40°09′00″ 71°21′00″' 850
1,400 Intermediate 2
Yuco
L2 40°09′07″ 71°30′39″
930
1,900 Low
3
Quilanlahue L3 40°08′18″ 71°28′04″
910
2,000 High (SSRs) 3
Nonthué
L4 40°08′46″ 71°37′03″
680
2,450 Intermediate 3
Hua Hum
L5 40°07′55″ 71°40′02″
670
2,500 Low
3
Quila Quina L6 40°10′40″ 71°26′37″
980
1,300 High
3 (sz)
Catritre
L7 40°10′26″ 71°24′10″
700
1,300 -
3
Pío Protto
L8 40°06′48″ 71°14′31″
840
900 -
3
Quillén
Corral
Bueyes
Q1 39°22′16″ 71°17′31″ 1,140
1,500 Intermediate 1
Ñorquinco Seccional
Ñ1 39°09′11″ 71°15′03″ 1,070
1,500 High
1
Aluminé
Pilo lil
P1 39°30′05″ 70°57′44″
835
700 Low
1
Epulauquen Epulauquen E1 36°49′09″ 71°04′07″ 1,500
1,500 High
1 (sz)
Genetic diversity level estimated by means of cpDNA, isozyme and microsatellite markers (except
for Quilanlahue population)
References: sz (subzone)
M. M. Azpilicueta et al.