

48 Ecology and Applied Environmental Science
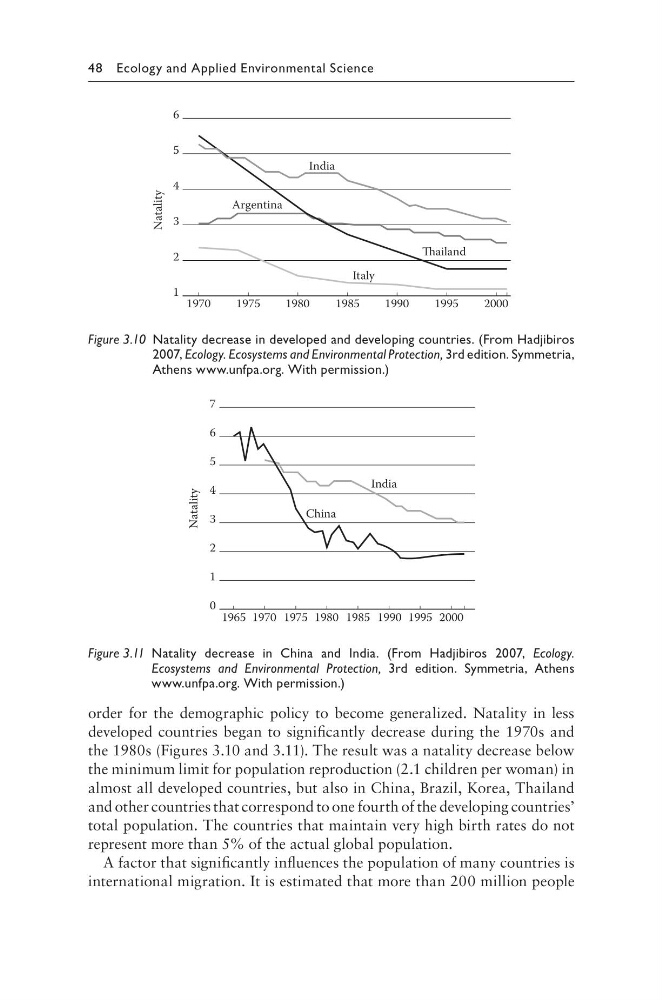
order for the demographic policy to become generalized. Natality in less
developed countries began to significantly decrease during the 1970s and
the 1980s (Figures 3.10 and 3.11). The result was a natality decrease below
the minimum limit for population reproduction (2.1 children per woman) in
almost all developed countries, but also in China, Brazil, Korea, Thailand
and other countries that correspond to one fourth of the developing countries’
total population. The countries that maintain very high birth rates do not
represent more than 5% of the actual global population.
A factor that significantly influences the population of many countries is
international migration. It is estimated that more than 200 million people
1
1970
1975
1980
1985
1990
1995
2000
2
3
4
5
6
Natality
India
Argentina
Italy
Figure 3.10 Natality decrease in developed and developing countries. (From Hadjibiros
2007, Ecology. Ecosystems and Environmental Protection, 3rd edition. Symmetria,
Athens www.unfpa.org. With permission.)
1965 1970 1975 1980 1985 1990 1995 2000
0
1
2
3
4
5
6
7
Natality
India
China
Figure 3.11 Natality decrease in China and India. (From Hadjibiros 2007, Ecology.
Ecosystems and Environmental Protection, 3rd edition. Symmetria, Athens
www.unfpa.org. With permission.)
order for the demographic policy to become generalized. Natality in less
developed countries began to significantly decrease during the 1970s and
the 1980s (Figures 3.10 and 3.11). The result was a natality decrease below
the minimum limit for population reproduction (2.1 children per woman) in
almost all developed countries, but also in China, Brazil, Korea, Thailand
and other countries that correspond to one fourth of the developing countries’
total population. The countries that maintain very high birth rates do not
represent more than 5% of the actual global population.
A factor that significantly influences the population of many countries is
international migration. It is estimated that more than 200 million people
1
1970
1975
1980
1985
1990
1995
2000
2
3
4
5
6
Natality
India
Argentina
Italy
Figure 3.10 Natality decrease in developed and developing countries. (From Hadjibiros
2007, Ecology. Ecosystems and Environmental Protection, 3rd edition. Symmetria,
Athens www.unfpa.org. With permission.)
1965 1970 1975 1980 1985 1990 1995 2000
0
1
2
3
4
5
6
7
Natality
India
China
Figure 3.11 Natality decrease in China and India. (From Hadjibiros 2007, Ecology.
Ecosystems and Environmental Protection, 3rd edition. Symmetria, Athens
www.unfpa.org. With permission.)