

This mapping command will output a .sam file (see Sect. 7.2.4) for each .fastq file in the
defined output directory and *.bowtie2.unaligned.fq as well as *.bowtie2.log files (summary of mapping progress) in the input directory.
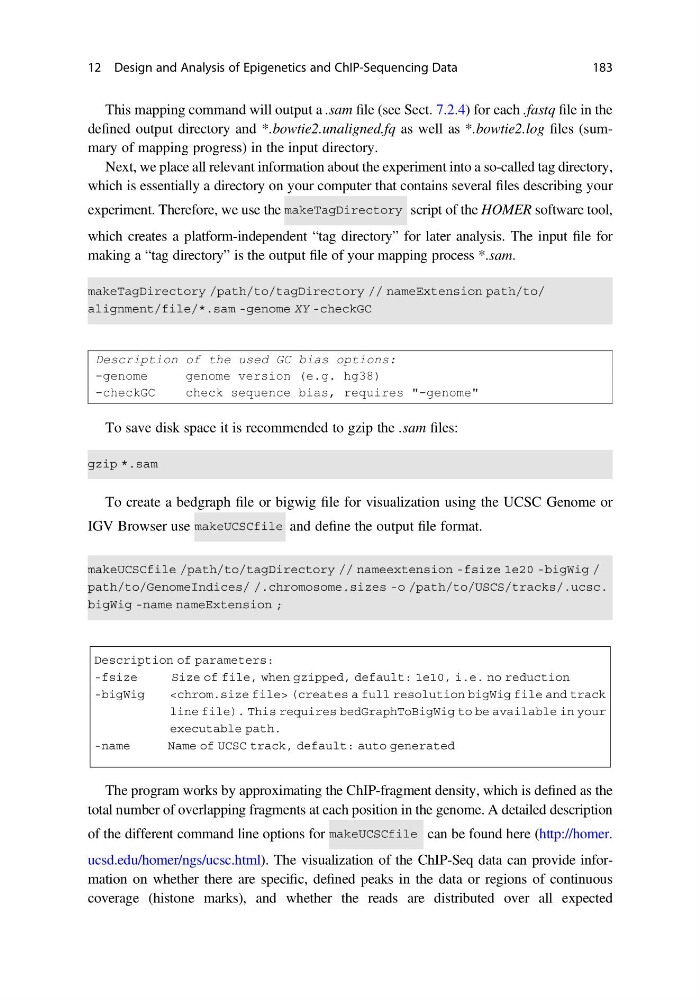
Next, we place all relevant information about the experiment into a so-called tag directory,
which is essentially a directory on your computer that contains several files describing your
experiment. Therefore, we use the
script of the HOMER software tool,
which creates a platform-independent “tag directory” for later analysis. The input file for
making a “tag directory” is the output file of your mapping process *.sam.
Description of the used GC bias options:
-genome
genome version (e.g. hg38)
-checkGC
check sequence bias, requires "-genome"
To save disk space it is recommended to gzip the .sam files:
To create a bedgraph file or bigwig file for visualization using the UCSC Genome or
IGV Browser use
and define the output file format.
The program works by approximating the ChIP-fragment density, which is defined as the
total number of overlapping fragments at each position in the genome. A detailed description
of the different command line options for
can be found here (http://homer.
ucsd.edu/homer/ngs/ucsc.html). The visualization of the ChIP-Seq data can provide information on whether there are specific, defined peaks in the data or regions of continuous
coverage (histone marks), and whether the reads are distributed over all expected
12 Design and Analysis of Epigenetics and ChIP-Sequencing Data
183
defined output directory and *.bowtie2.unaligned.fq as well as *.bowtie2.log files (summary of mapping progress) in the input directory.
Next, we place all relevant information about the experiment into a so-called tag directory,
which is essentially a directory on your computer that contains several files describing your
experiment. Therefore, we use the
script of the HOMER software tool,
which creates a platform-independent “tag directory” for later analysis. The input file for
making a “tag directory” is the output file of your mapping process *.sam.
Description of the used GC bias options:
-genome
genome version (e.g. hg38)
-checkGC
check sequence bias, requires "-genome"
To save disk space it is recommended to gzip the .sam files:
To create a bedgraph file or bigwig file for visualization using the UCSC Genome or
IGV Browser use
and define the output file format.
The program works by approximating the ChIP-fragment density, which is defined as the
total number of overlapping fragments at each position in the genome. A detailed description
of the different command line options for
can be found here (http://homer.
ucsd.edu/homer/ngs/ucsc.html). The visualization of the ChIP-Seq data can provide information on whether there are specific, defined peaks in the data or regions of continuous
coverage (histone marks), and whether the reads are distributed over all expected
12 Design and Analysis of Epigenetics and ChIP-Sequencing Data
183