

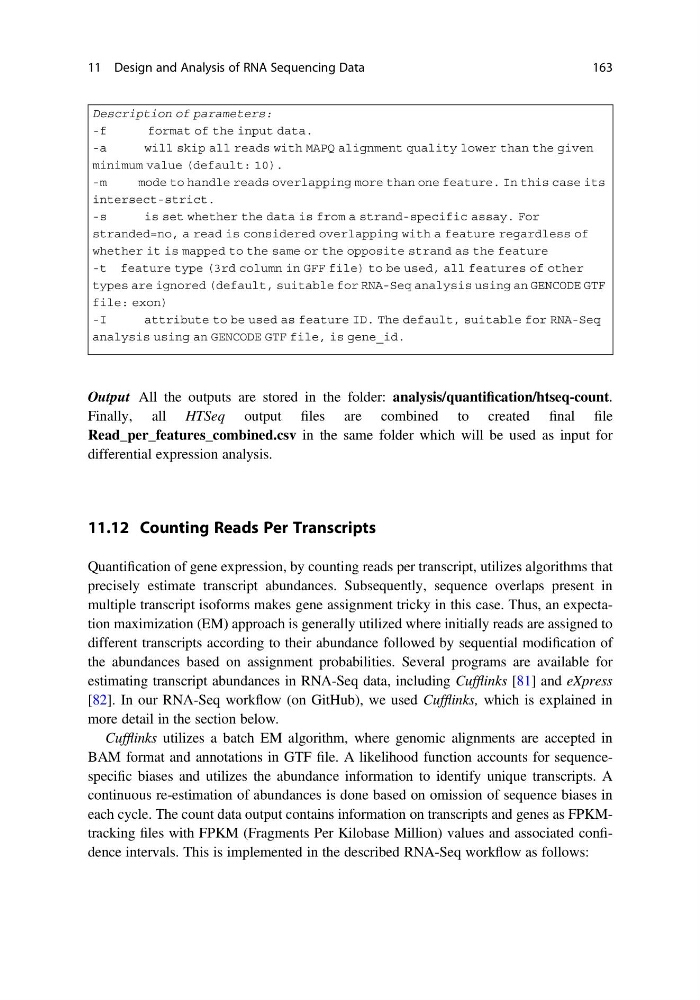
Output All the outputs are stored in the folder: analysis/quantification/htseq-count.
Finally, all HTSeq output files are combined to created final file
Read_per_features_combined.csv in the same folder which will be used as input for
differential expression analysis.
11.12 Counting Reads Per Transcripts
Quantification of gene expression, by counting reads per transcript, utilizes algorithms that
precisely estimate transcript abundances. Subsequently, sequence overlaps present in
multiple transcript isoforms makes gene assignment tricky in this case. Thus, an expectation maximization (EM) approach is generally utilized where initially reads are assigned to
different transcripts according to their abundance followed by sequential modification of
the abundances based on assignment probabilities. Several programs are available for
estimating transcript abundances in RNA-Seq data, including Cufflinks [81] and eXpress
[82]. In our RNA-Seq workflow (on GitHub), we used Cufflinks, which is explained in
more detail in the section below.
Cufflinks utilizes a batch EM algorithm, where genomic alignments are accepted in
BAM format and annotations in GTF file. A likelihood function accounts for sequencespecific biases and utilizes the abundance information to identify unique transcripts. A
continuous re-estimation of abundances is done based on omission of sequence biases in
each cycle. The count data output contains information on transcripts and genes as FPKMtracking files with FPKM (Fragments Per Kilobase Million) values and associated confidence intervals. This is implemented in the described RNA-Seq workflow as follows:
11 Design and Analysis of RNA Sequencing Data
163
Finally, all HTSeq output files are combined to created final file
Read_per_features_combined.csv in the same folder which will be used as input for
differential expression analysis.
11.12 Counting Reads Per Transcripts
Quantification of gene expression, by counting reads per transcript, utilizes algorithms that
precisely estimate transcript abundances. Subsequently, sequence overlaps present in
multiple transcript isoforms makes gene assignment tricky in this case. Thus, an expectation maximization (EM) approach is generally utilized where initially reads are assigned to
different transcripts according to their abundance followed by sequential modification of
the abundances based on assignment probabilities. Several programs are available for
estimating transcript abundances in RNA-Seq data, including Cufflinks [81] and eXpress
[82]. In our RNA-Seq workflow (on GitHub), we used Cufflinks, which is explained in
more detail in the section below.
Cufflinks utilizes a batch EM algorithm, where genomic alignments are accepted in
BAM format and annotations in GTF file. A likelihood function accounts for sequencespecific biases and utilizes the abundance information to identify unique transcripts. A
continuous re-estimation of abundances is done based on omission of sequence biases in
each cycle. The count data output contains information on transcripts and genes as FPKMtracking files with FPKM (Fragments Per Kilobase Million) values and associated confidence intervals. This is implemented in the described RNA-Seq workflow as follows:
11 Design and Analysis of RNA Sequencing Data
163