

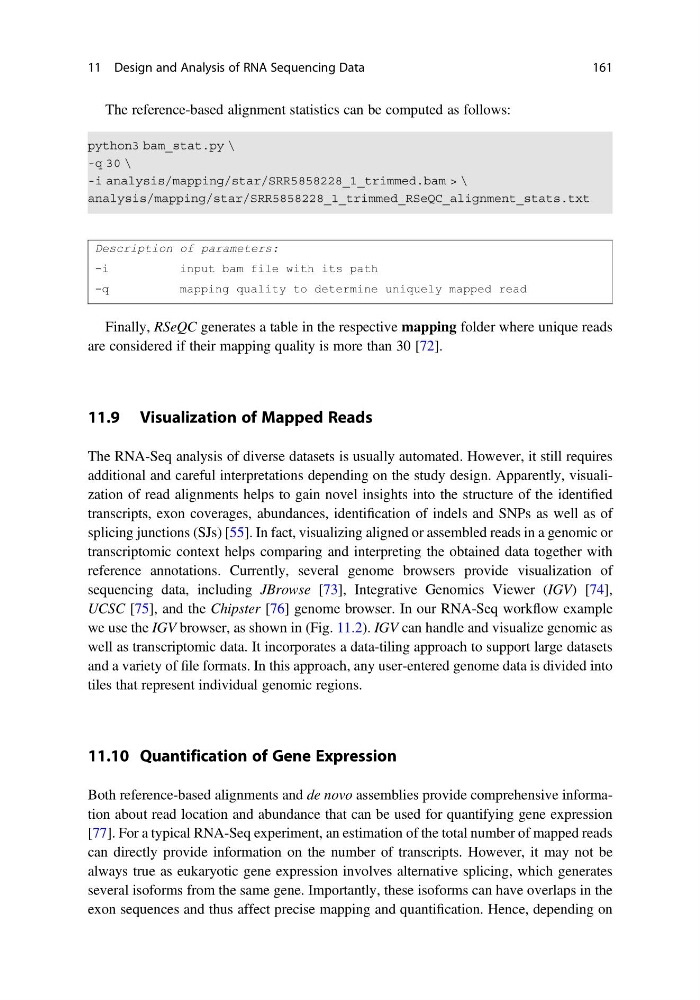
The reference-based alignment statistics can be computed as follows:
Description of parameters:
-i
input bam file with its path
-q
mapping quality to determine uniquely mapped read
Finally, RSeQC generates a table in the respective mapping folder where unique reads
are considered if their mapping quality is more than 30 [72].
11.9 Visualization of Mapped Reads
The RNA-Seq analysis of diverse datasets is usually automated. However, it still requires
additional and careful interpretations depending on the study design. Apparently, visualization of read alignments helps to gain novel insights into the structure of the identified
transcripts, exon coverages, abundances, identification of indels and SNPs as well as of
splicing junctions (SJs) [55]. In fact, visualizing aligned or assembled reads in a genomic or
transcriptomic context helps comparing and interpreting the obtained data together with
reference annotations. Currently, several genome browsers provide visualization of
sequencing data, including JBrowse [73], Integrative Genomics Viewer (IGV) [74],
UCSC [75], and the Chipster [76] genome browser. In our RNA-Seq workflow example
we use the IGV browser, as shown in (Fig. 11.2). IGV can handle and visualize genomic as
well as transcriptomic data. It incorporates a data-tiling approach to support large datasets
and a variety of file formats. In this approach, any user-entered genome data is divided into
tiles that represent individual genomic regions.
11.10 Quantification of Gene Expression
Both reference-based alignments and de novo assemblies provide comprehensive information about read location and abundance that can be used for quantifying gene expression
[77]. For a typical RNA-Seq experiment, an estimation of the total number of mapped reads
can directly provide information on the number of transcripts. However, it may not be
always true as eukaryotic gene expression involves alternative splicing, which generates
several isoforms from the same gene. Importantly, these isoforms can have overlaps in the
exon sequences and thus affect precise mapping and quantification. Hence, depending on
11 Design and Analysis of RNA Sequencing Data
161
Description of parameters:
-i
input bam file with its path
-q
mapping quality to determine uniquely mapped read
Finally, RSeQC generates a table in the respective mapping folder where unique reads
are considered if their mapping quality is more than 30 [72].
11.9 Visualization of Mapped Reads
The RNA-Seq analysis of diverse datasets is usually automated. However, it still requires
additional and careful interpretations depending on the study design. Apparently, visualization of read alignments helps to gain novel insights into the structure of the identified
transcripts, exon coverages, abundances, identification of indels and SNPs as well as of
splicing junctions (SJs) [55]. In fact, visualizing aligned or assembled reads in a genomic or
transcriptomic context helps comparing and interpreting the obtained data together with
reference annotations. Currently, several genome browsers provide visualization of
sequencing data, including JBrowse [73], Integrative Genomics Viewer (IGV) [74],
UCSC [75], and the Chipster [76] genome browser. In our RNA-Seq workflow example
we use the IGV browser, as shown in (Fig. 11.2). IGV can handle and visualize genomic as
well as transcriptomic data. It incorporates a data-tiling approach to support large datasets
and a variety of file formats. In this approach, any user-entered genome data is divided into
tiles that represent individual genomic regions.
11.10 Quantification of Gene Expression
Both reference-based alignments and de novo assemblies provide comprehensive information about read location and abundance that can be used for quantifying gene expression
[77]. For a typical RNA-Seq experiment, an estimation of the total number of mapped reads
can directly provide information on the number of transcripts. However, it may not be
always true as eukaryotic gene expression involves alternative splicing, which generates
several isoforms from the same gene. Importantly, these isoforms can have overlaps in the
exon sequences and thus affect precise mapping and quantification. Hence, depending on
11 Design and Analysis of RNA Sequencing Data
161